
- Moving the markets
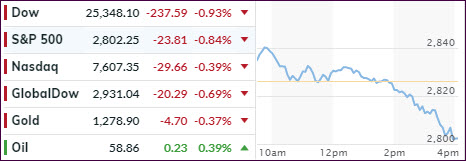
An early bounce, which looks to have been of the dead-cat nature, lost momentum, first slowly and then quickly. The major indexes ended up diving into the close and scoring their low of the day as the final bell rang—not a good omen for tomorrow’s opening.
Early in the session, we saw some misplaced optimism regarding the ever-dangling China trade carrot, but as tensions between the warring parties heated up, supported by tit-for-tat escalations, the bulls threw in the towel and down we went.
Helping to put the final nail in the trade coffin was Trump’s comment during a news conference in Japan that the U.S. wasn’t ready to make a deal with China. That was followed by “tariffs on Chinese products could go up very substantially.” Even the speed-reading computer algos could not misinterpret what had been said.
On the econ data front, we learned that while home prices rose in March by +0.1%, it was, however, the slowest annual pace since August 2012. For a positive change, we saw Consumer Confidence rise to 134.1 from 129.2 in April, which was above economists’ expectations of 130.
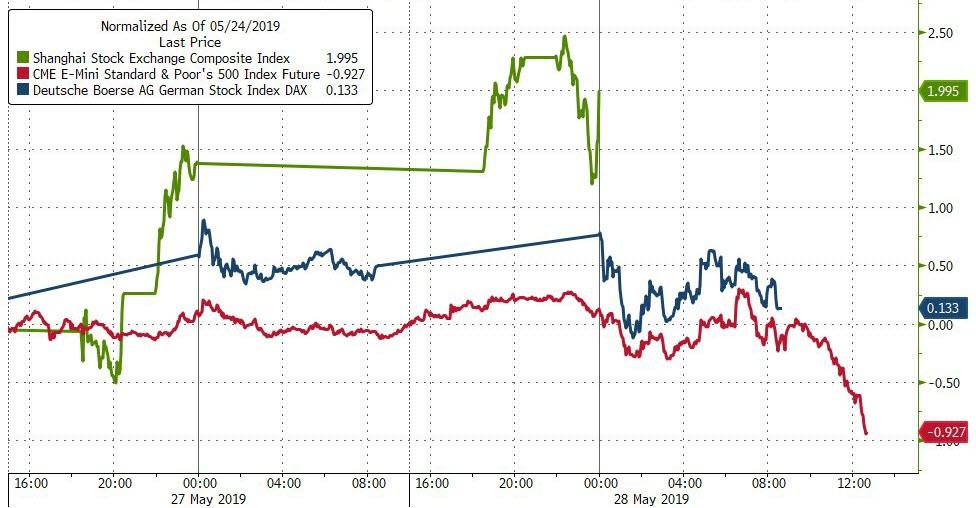
In the bigger picture, it’s interesting to note that the U.S. stock market ended up far worse than Europe and China, as this chart demonstrates. And that despite expectations that month-end pension rebalancing might spark new buying but, there are still a few days left.
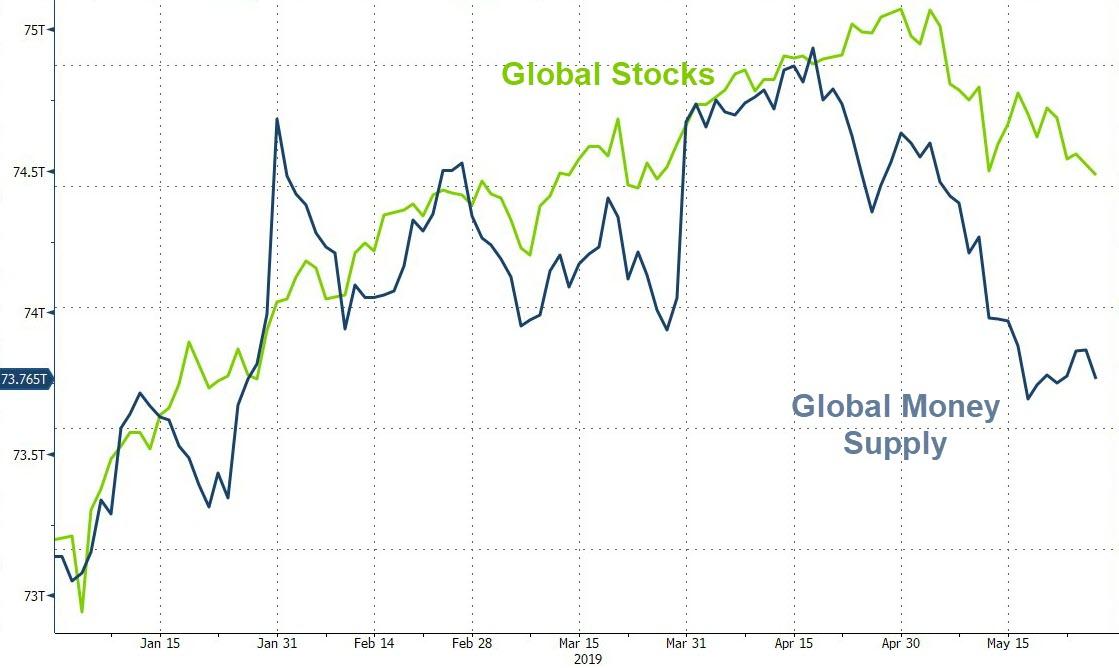
On the other hand, the picture of a slowdown in global money supply, and its effect on stocks, continues to worsen, which is showing up in our International Trend Tracking Index (TTI). This indicator has already moved into bearish territory, but just not yet to a large enough margin, to push the ‘Sell’ button. However, this picture could change quickly.
2. ETFs in the Spotlight
In case you missed the announcement and description of this section, you can read it here again.
It features 10 broadly diversified and sector ETFs from my HighVolume list as posted every Saturday. Furthermore, they are screened for the lowest MaxDD% number meaning they have been showing better resistance to temporary sell offs than all others over the past year.
The below table simply demonstrates the magnitude with which some of the ETFs are fluctuating regarding their positions above or below their respective individual trend lines (%+/-M/A). A break below, represented by a negative number, shows weakness, while a break above, represented by a positive percentage, shows strength.
For hundreds of ETF choices, be sure to reference Thursday’s StatSheet.
For this current domestic “Buy” cycle, here’s how some our candidates have fared:
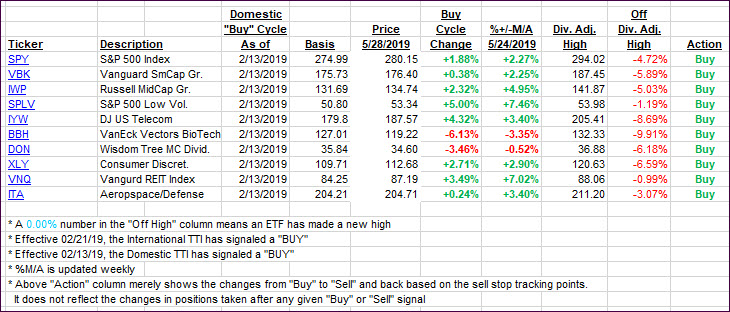
Again, the %+/-M/A column above shows the position of the various ETFs in relation to their respective long-term trend lines, while the trailing sell stops are being tracked in the “Off High” column. The “Action” column will signal a “Sell” once the -8% point has been taken out in the “Off High” column. For more volatile sector ETFs, the trigger point is -10%.
3. Trend Tracking Indexes (TTIs)
Our Trend Tracking Indexes (TTIs) headed sharply south, as the markets dove into the close. While the Domestic one is remaining on the bullish side of its trend line, the International’s position below the line has worsened and is within striking distance of a new ‘Sell’ signal. This could materialize this week, should a rebound not occur.
Here’s how we closed 05/28/2019:
Domestic TTI: +0.91% above its M/A (last close +2.02%)—Buy signal effective 02/13/2019
International TTI: -1.09% below its M/A (last close -0.42%)—Buy signal effective 02/21/2019
Disclosure: I am obliged to inform you that I, as well as my advisory clients, own some of the ETFs listed in the above table. Furthermore, they do not represent a specific investment recommendation for you, they merely show which ETFs from the universe I track are falling within the specified guidelines.
Contact Ulli