
- Moving the markets
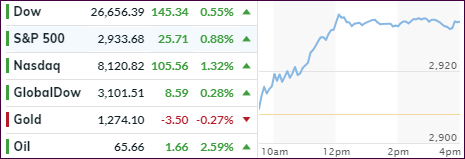
When markets get stuck in a tight sideways trading range, as we’ve seen over the past couple of weeks, a breakout, either to the downside or upside, will transpire sooner or later. It may not always be clear what causes such a breakout, but it occurred today with the bulls taking charge and pushing the S&P 500 and Nasdaq into record territory.
While earnings were mixed, some companies stood out and gave a boost to the markets. Topping the list were United Technologies, Coca Cola, both of which paled in comparison to Twitter’s 15.7% gain rallying on better than expected user growth. Toymaker Hasbro took second place with its shares advancing a solid 15%.
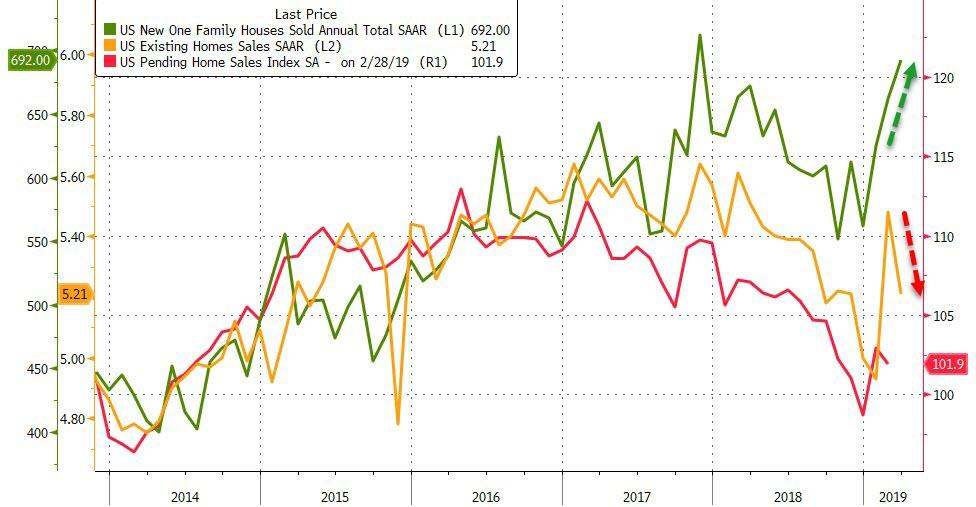
An unexpected assist came from the economic front, as new home sales soared to 16-month highs in the face of plunging prices and slipping existing home sales. Still, this was the third straight month that new homes sales have risen.
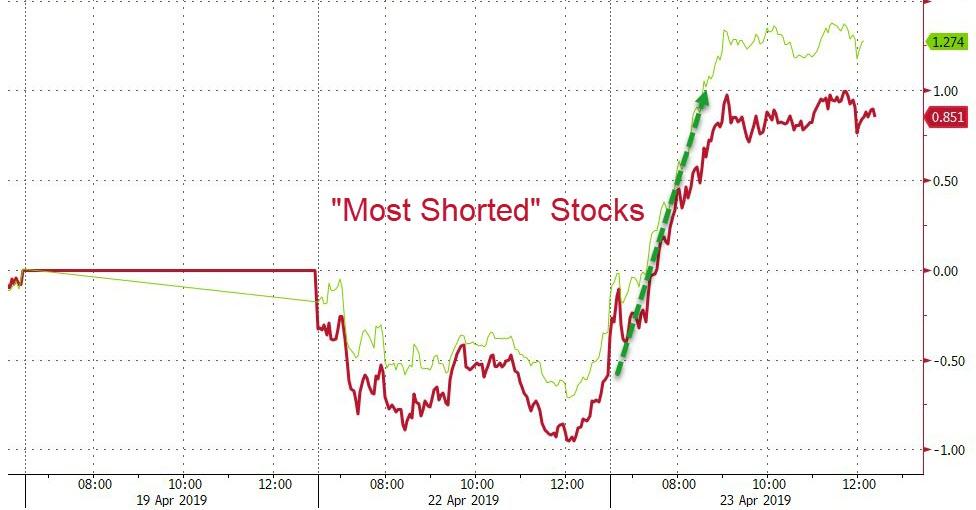
Also helping today’s ramp was a short-squeeze, which provided the push to get the S&P into record territory. All in all, it was a good day for the bulls, as the advances were broad.
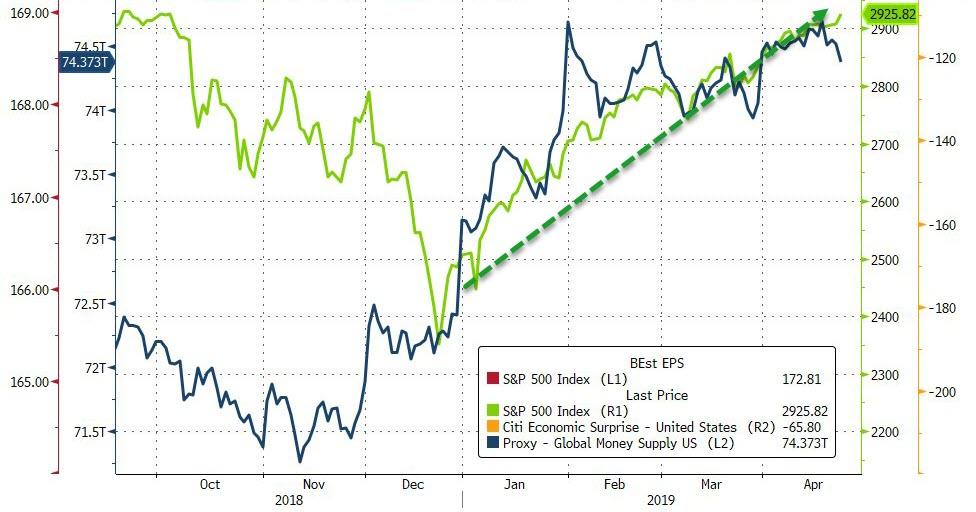
However, I have to wonder if there is enough gas in the tank left to keep this rally going given the amount of weakening economic data points, we have seen YTD. But, that may be a moot point because, as long as there is enough money pumped into the global economies, nothing else appears to matter, as this chart clearly shows.
- ETFs in the Spotlight
In case you missed the announcement and description of this section, you can read it here again.
It features 10 broadly diversified and sector ETFs from my HighVolume list as posted every Saturday. Furthermore, they are screened for the lowest MaxDD% number meaning they have been showing better resistance to temporary sell offs than all others over the past year.
The below table simply demonstrates the magnitude with which some of the ETFs are fluctuating regarding their positions above or below their respective individual trend lines (%+/-M/A). A break below, represented by a negative number, shows weakness, while a break above, represented by a positive percentage, shows strength.
For hundreds of ETF choices, be sure to reference Thursday’s StatSheet.
For this current domestic “Buy” cycle, here’s how some our candidates have fared:
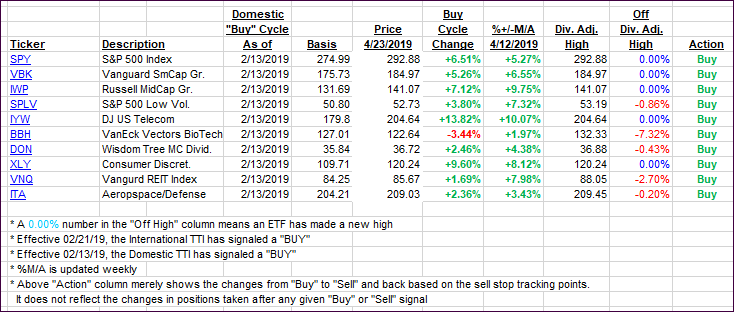
Again, the %+/-M/A column above shows the position of the various ETFs in relation to their respective long-term trend lines, while the trailing sell stops are being tracked in the “Off High” column. The “Action” column will signal a “Sell” once the -8% point has been taken out in the “Off High” column. For more volatile sector ETFs, the trigger point is -10%.
- Trend Tracking Indexes (TTIs)
Our Trend Tracking Indexes (TTIs) stormed higher with the Domestic one showing more spunk than the international one during this day of the S&P 500 and Nasdaq setting new records.
Here’s how we closed 04/23/2019:
Domestic TTI: +6.58% above its M/A (last close +5.60%)—Buy signal effective 02/13/2019
International TTI: +4.46% above its M/A (last close +4.18%)—Buy signal effective 02/21/2019
Disclosure: I am obliged to inform you that I, as well as my advisory clients, own some of the ETFs listed in the above table. Furthermore, they do not represent a specific investment recommendation for you, they merely show which ETFs from the universe I track are falling within the specified guidelines.
Contact Ulli