
- Moving the markets
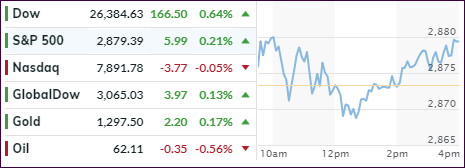
The major indexes, except for the Nasdaq, were able to keep the bullish theme alive with the S&P 500 vacillating around its unchanged line before making a final spurt above it to close in the green. The Dow never dipped into the red and was engaged in a steady uptrend, while the Nasdaq was the odd man out by having a bumpy ride and falling a tad short of closing higher.
As happened yesterday, the U.S.-China trade talks remained in the spotlight with high expectations that both parties will be able to resolve their differences. Helping matters was Trump’s remark that talks were “moving along nicely,” even though no facts to back up this nicety were presented. In other words, the trade-talk-carrot continues to work wonders with equities.
On the economic front, we learned that initial jobless claims crashed to the lowest in 50 years, which provided some optimism for tomorrow’s payroll report that it would turn out better than last month’s disaster reading.
The hits keep on coming for the European economic powerhouse Germany. After growth forecasts were slashed by more than half yesterday, industrial orders plunged 8.2%, the most since the financial crisis. The cause was described as not reflecting global demand but more specific by the GDP contraction in Turkey.
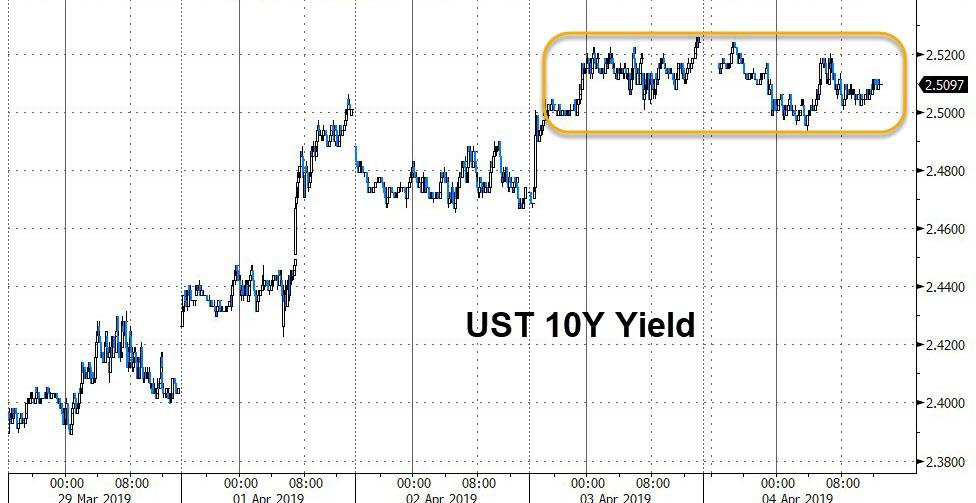
Interest rates were steady with the 10-year bond yield hovering around the 2.5% level, which has been a floor over the past couple of days, as this chart shows. However, this could change tomorrow depending on the outcome of the jobs report.
- ETFs in the Spotlight
In case you missed the announcement and description of this section, you can read it here again.
It features 10 broadly diversified and sector ETFs from my HighVolume list as posted every Saturday. Furthermore, they are screened for the lowest MaxDD% number meaning they have been showing better resistance to temporary sell offs than all others over the past year.
The below table simply demonstrates the magnitude with which some of the ETFs are fluctuating regarding their positions above or below their respective individual trend lines (%+/-M/A). A break below, represented by a negative number, shows weakness, while a break above, represented by a positive percentage, shows strength.
For hundreds of ETF choices, be sure to reference Thursday’s StatSheet.
For this current domestic “Buy” cycle, here’s how some our candidates have fared:
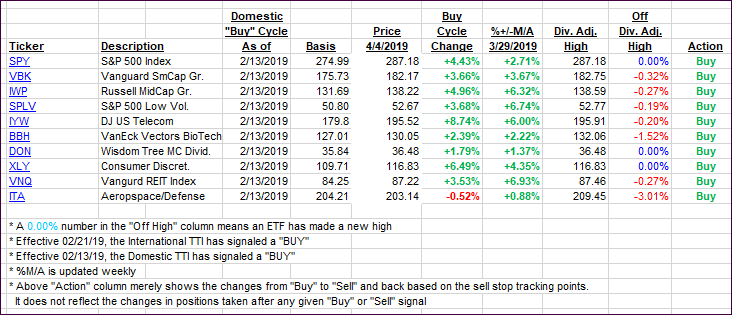
Again, the %+/-M/A column above shows the position of the various ETFs in relation to their respective long-term trend lines, while the trailing sell stops are being tracked in the “Off High” column. The “Action” column will signal a “Sell” once the -8% point has been taken out in the “Off High” column. For more volatile sector ETFs, the trigger point is -10%.
- Trend Tracking Indexes (TTIs)
Our Trend Tracking Indexes (TTIs) inched up despite a mixed market picture.
Here’s how we closed 04/04/2019:
Domestic TTI: +5.48% above its M/A (last close +5.13%)—Buy signal effective 02/13/2019
International TTI: +3.39% above its M/A (last close +3.25%)—Buy signal effective 02/21/2019
Disclosure: I am obliged to inform you that I, as well as my advisory clients, own some of the ETFs listed in the above table. Furthermore, they do not represent a specific investment recommendation for you, they merely show which ETFs from the universe I track are falling within the specified guidelines.
Contact Ulli