
- Moving the markets
The U.S.-China trade deal carrot, which has been dangled over the markets on many occasions in order to elicit a bullish response, moved to center stage again, as reports surfaced that a deal was 90% done.
Of course, as we’ve seen in the past, there were no definitive announcements, but merely hope that a deal will be reached in the coming weeks or months. Talks are allegedly in the endgame stage with the last 10% being the hardest and trickiest part requiring concessions on both sides.
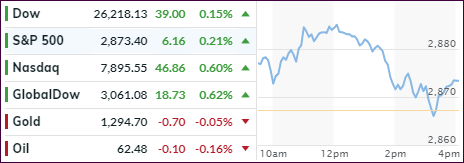
For sure, it helped the markets find some footing after an early drift and upward momentum was restored at first before it faded again. But a last hour spurt assisted the indexes to a green close.
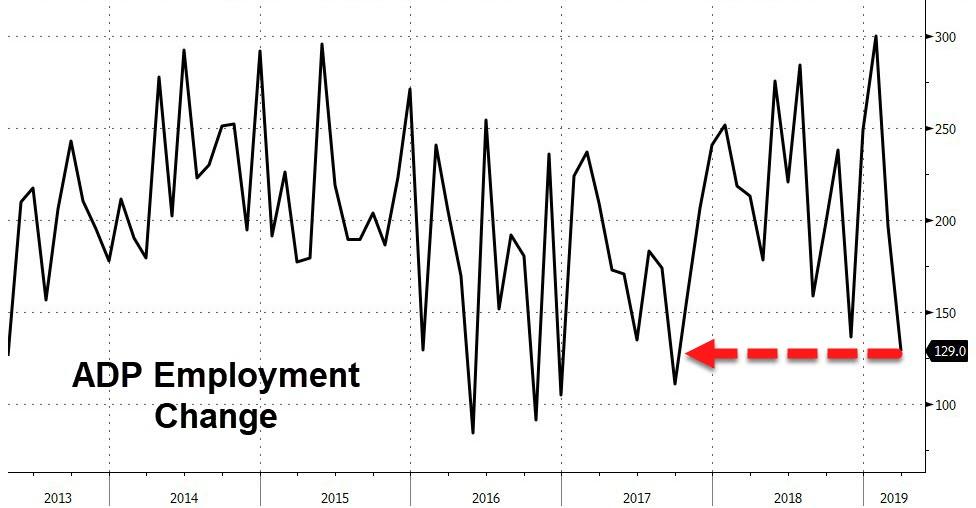
Not helping matters, and providing a negative background, was ADP with a dismal print of just +129k new jobs in March vs. an expected +175k, which is the weakest growth since September 2017. Then the US services PMI showed its ugliness by plunging to 19-month lows (from 59.7 to 56.1). At same time, US auto sales ended a cruel first quarter with dismal results for March with sharp year-over-year sales declines.
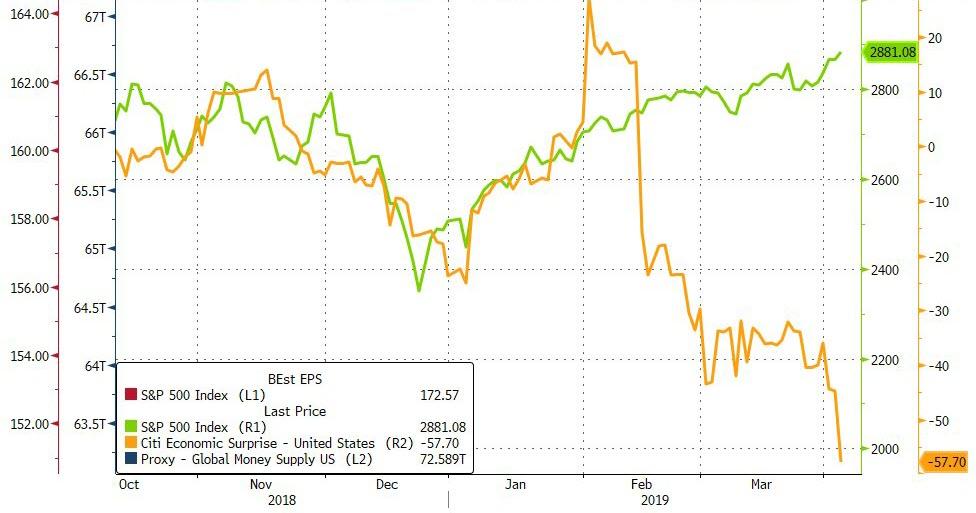
Given all that, we should have seen more of a sell-off but remember, in the new normal environment we’re living in, the level or direction of the stock market has nothing to do with underlying fundamentals. Even bond yields were off today with yields rising in the face of poor economic data. Go figure…
In the end, bad news was good news again with the major indexes managing to eke out some modest gains supporting our bullish stance.
- ETFs in the Spotlight
In case you missed the announcement and description of this section, you can read it here again.
It features 10 broadly diversified and sector ETFs from my HighVolume list as posted every Saturday. Furthermore, they are screened for the lowest MaxDD% number meaning they have been showing better resistance to temporary sell offs than all others over the past year.
The below table simply demonstrates the magnitude with which some of the ETFs are fluctuating regarding their positions above or below their respective individual trend lines (%+/-M/A). A break below, represented by a negative number, shows weakness, while a break above, represented by a positive percentage, shows strength.
For hundreds of ETF choices, be sure to reference Thursday’s StatSheet.
For this current domestic “Buy” cycle, here’s how some our candidates have fared:
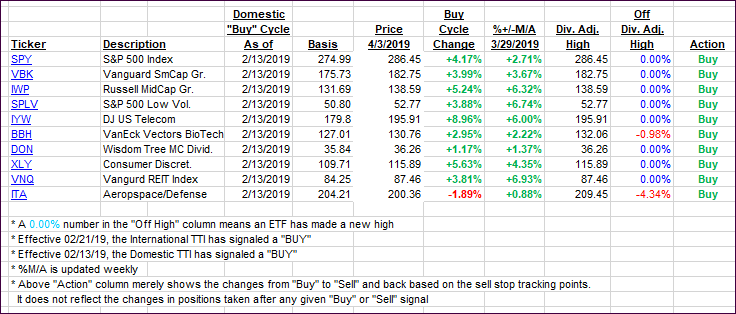
Again, the %+/-M/A column above shows the position of the various ETFs in relation to their respective long-term trend lines, while the trailing sell stops are being tracked in the “Off High” column. The “Action” column will signal a “Sell” once the -8% point has been taken out in the “Off High” column. For more volatile sector ETFs, the trigger point is -10%.
- Trend Tracking Indexes (TTIs)
Our Trend Tracking Indexes (TTIs) headed higher and deeper into bullish territory.
Here’s how we closed 04/03/2019:
Domestic TTI: +5.13% above its M/A (last close +4.84%)—Buy signal effective 02/13/2019
International TTI: +3.25% above its M/A (last close +2.71%)—Buy signal effective 02/21/2019
Disclosure: I am obliged to inform you that I, as well as my advisory clients, own some of the ETFs listed in the above table. Furthermore, they do not represent a specific investment recommendation for you, they merely show which ETFs from the universe I track are falling within the specified guidelines.
Contact Ulli