
- Moving the markets
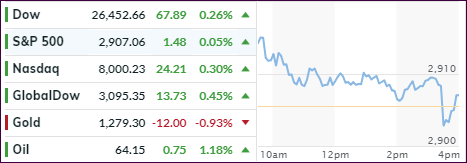
An early rally petered out as the S&P 500 slowly but surely drifted towards its unchanged line and suddenly dropped below it. However, thanks to a last minute levitation, the index managed to crawl back above it to close fractionally in the green.
The other two major indexes showed a little more staying power and remained above their respective unchanged lines throughout the session. The Nasdaq bounced around its 8,000 marker and ended up closing above it by the tiniest of margins.
Today we saw a lack of upside follow through along with little enthusiasm as earnings provided a mixed picture. Analysts have now resigned themselves to the fact that a YoY reduction in S&P 500 corporate profits for the first quarter is pretty much assured, which would mean the first decline in 3 years.
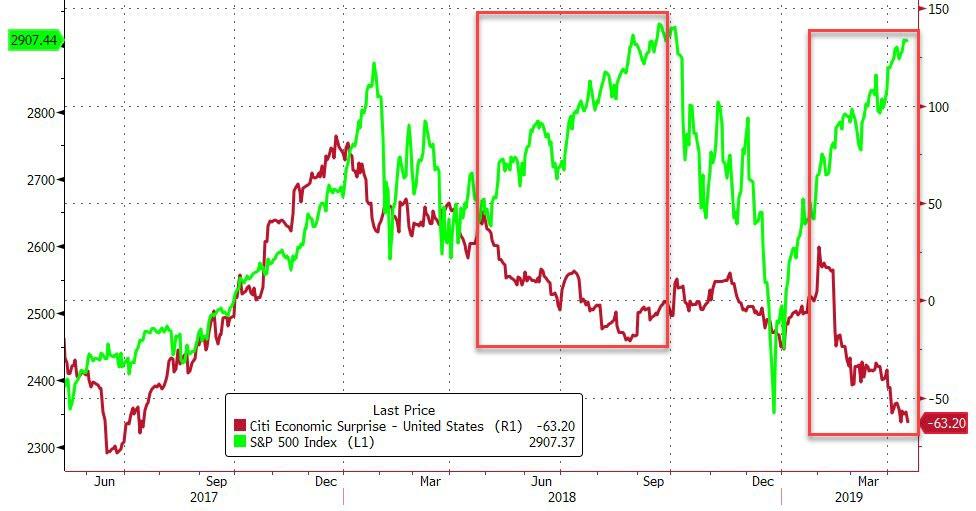
Still, we are within striking distance of taking out the 2018 highs, and I am sure that the computer algos are set to accomplish this feat—all in due time. Again, current market levels are in no way related to the strength of the underlying economy.
The direction of the economic surprise index made that very clear last year, after the spread with the S&P 500 simply widened too much, and the bears ended up having a field day.
As a result, the Fed was forced to step on the emergency brakes by doing a U-turn with their interest policy in order to “save” the markets.
Are we in for a repeat, or will we see new all-time highs first?
- ETFs in the Spotlight
In case you missed the announcement and description of this section, you can read it here again.
It features 10 broadly diversified and sector ETFs from my HighVolume list as posted every Saturday. Furthermore, they are screened for the lowest MaxDD% number meaning they have been showing better resistance to temporary sell offs than all others over the past year.
The below table simply demonstrates the magnitude with which some of the ETFs are fluctuating regarding their positions above or below their respective individual trend lines (%+/-M/A). A break below, represented by a negative number, shows weakness, while a break above, represented by a positive percentage, shows strength.
For hundreds of ETF choices, be sure to reference Thursday’s StatSheet.
For this current domestic “Buy” cycle, here’s how some our candidates have fared:
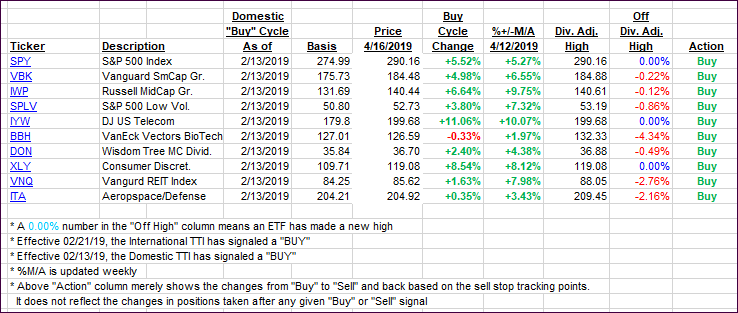
Again, the %+/-M/A column above shows the position of the various ETFs in relation to their respective long-term trend lines, while the trailing sell stops are being tracked in the “Off High” column. The “Action” column will signal a “Sell” once the -8% point has been taken out in the “Off High” column. For more volatile sector ETFs, the trigger point is -10%.
- Trend Tracking Indexes (TTIs)
Our Trend Tracking Indexes (TTIs) eked out a gain with the International one showing more strength.
Here’s how we closed 04/16/2019:
Domestic TTI: +6.36% above its M/A (last close +6.32%)—Buy signal effective 02/13/2019
International TTI: +4.31% above its M/A (last close +3.82%)—Buy signal effective 02/21/2019
Disclosure: I am obliged to inform you that I, as well as my advisory clients, own some of the ETFs listed in the above table. Furthermore, they do not represent a specific investment recommendation for you, they merely show which ETFs from the universe I track are falling within the specified guidelines.
Contact Ulli