
- Moving the markets
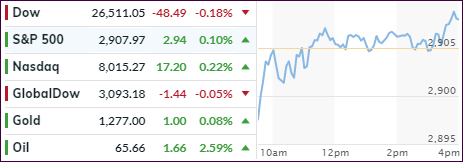
The major indexes took an early dive before slowly rebounding in an attempt to crawl back above their respective unchanged lines. The S&P 500 and Nasdaq succeeded in that effort by a tiny margin, while the Dow just fell short.
It was a repeat performance of what we saw all last week with a narrow trading range continuing to be the theme of the day. With bond yields rising a tad, conservative equity ETFs endured their slump as rising rates, which are the conservative component in these instruments, pulled back more than the indexes they are based on.
Case in point is the S&P 500, represented by SPY, which managed to eke out a gain of +0.10% during today’s session. It’s conservative cousin, namely SPLV, gave back -0.39% due to the spike in bond yields. Once that scenario reverses, and the markets correct, you will see the exact opposite, as SPLV will hold up better than SPY.
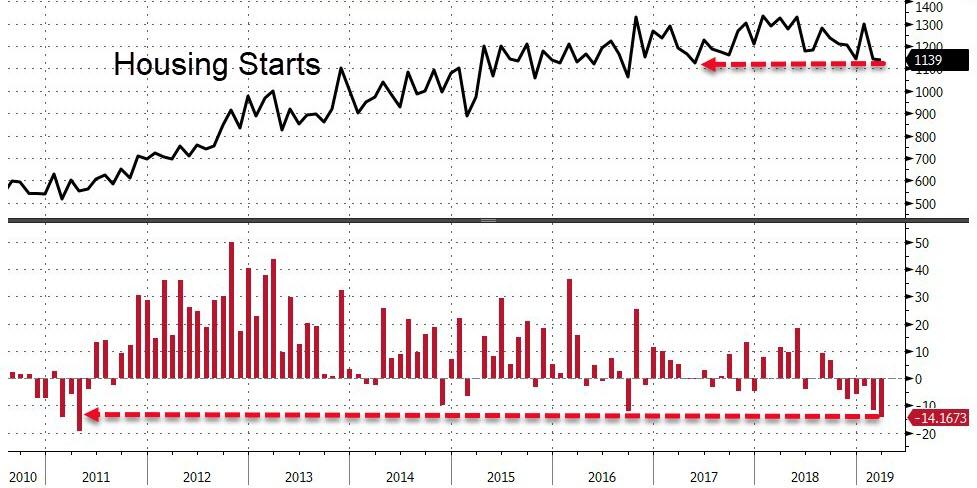
On the economic front, we saw housing starts collapse, as February’s -8.7% plunge was revised to an unreal -12%. For March, expectations were high that a rebound of some 5.4% would be a sure thing, but no, the number came in at -0.3%, making the annual drop the worst since 2011.
This is indeed a strange environment with trading volume extremely low and stocks simply being stuck. Consider that during April, the S&P 500 has not risen or fallen more than 1% on any given day. This atmosphere almost has the feeling of the calm before the storm.
Of course, some slowdown effect came from Europe, where markets were closed due to the extended Easter Holiday. Regarding earnings, things will accelerate next week with 153 S&P 500 companies being scheduled to release their report cards.
In the meantime, a market mover could be the advanced Q1 2019 GDP reading due out this Friday.
- ETFs in the Spotlight
In case you missed the announcement and description of this section, you can read it here again.
It features 10 broadly diversified and sector ETFs from my HighVolume list as posted every Saturday. Furthermore, they are screened for the lowest MaxDD% number meaning they have been showing better resistance to temporary sell offs than all others over the past year.
The below table simply demonstrates the magnitude with which some of the ETFs are fluctuating regarding their positions above or below their respective individual trend lines (%+/-M/A). A break below, represented by a negative number, shows weakness, while a break above, represented by a positive percentage, shows strength.
For hundreds of ETF choices, be sure to reference Thursday’s StatSheet.
For this current domestic “Buy” cycle, here’s how some our candidates have fared:
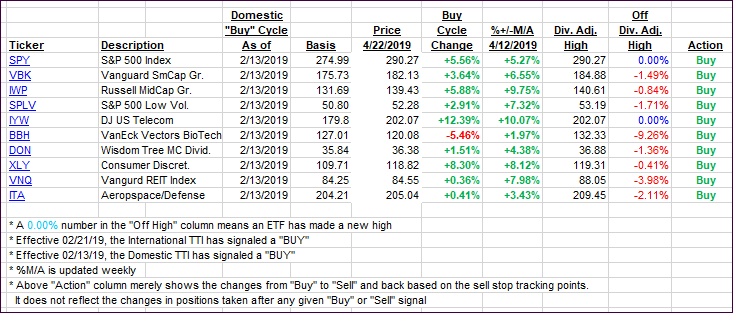
Again, the %+/-M/A column above shows the position of the various ETFs in relation to their respective long-term trend lines, while the trailing sell stops are being tracked in the “Off High” column. The “Action” column will signal a “Sell” once the -8% point has been taken out in the “Off High” column. For more volatile sector ETFs, the trigger point is -10%.
- Trend Tracking Indexes (TTIs)
Our Trend Tracking Indexes (TTIs) limped a little lower, as the sideways action continued.
Here’s how we closed 04/22/2019:
Domestic TTI: +5.60% above its M/A (last close +5.87%)—Buy signal effective 02/13/2019
International TTI: +4.18% above its M/A (last close +4.22%)—Buy signal effective 02/21/2019
Disclosure: I am obliged to inform you that I, as well as my advisory clients, own some of the ETFs listed in the above table. Furthermore, they do not represent a specific investment recommendation for you, they merely show which ETFs from the universe I track are falling within the specified guidelines.
Contact Ulli