
 [Chart courtesy of MarketWatch.com]
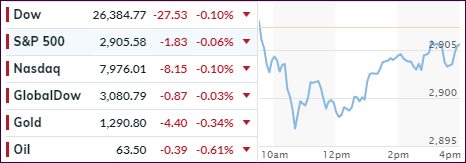
- Moving the markets
An early drop below the unchanged lines had the major indexes on the defensive right after the opening bell. After Friday’s decent start to the earning season, Goldman Sachs and Citi Group underwhelmed with their report cards.
With these two institutions being banking powerhouses, investors were disappointed as those two were expected to provide some clarity and guidance not only for the state of the banking sector but also for the economy in general.
That did not happen as both banks reported sharp earnings declines compared to Q1 last year, but at least they managed to exceed analysts’ low profit expectations. Now the experts are afraid that Q1 2019 earnings for the S&P 500 complex may suffer “the first YoY decline in nearly three years,” due to economic headwinds appearing to accelerate.
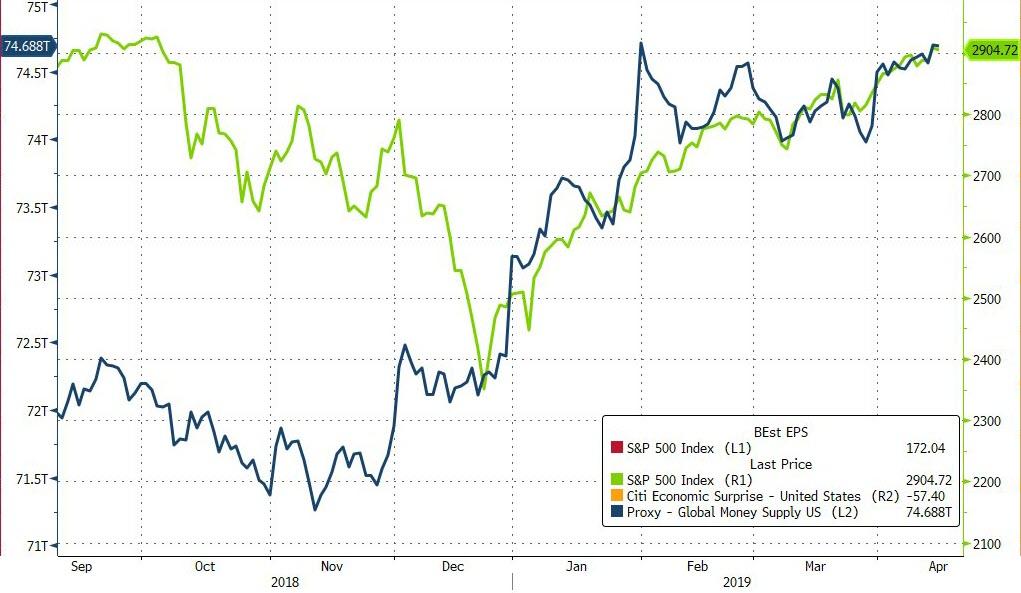
In the end, this turned out to be a “nothing” session with nothing gained and not much lost. Looking at the big picture, we can see that it’s not the global economy that is levitating the markets, it’s the ever-accelerating money supply, as this chart clearly demonstrates.
There is a good chance that this trend will continue, thereby throwing a much-needed assist to make sure that major indexes will take out their all-time highs made in 2018.
- ETFs in the Spotlight
In case you missed the announcement and description of this section, you can read it here again.
It features 10 broadly diversified and sector ETFs from my HighVolume list as posted every Saturday. Furthermore, they are screened for the lowest MaxDD% number meaning they have been showing better resistance to temporary sell offs than all others over the past year.
The below table simply demonstrates the magnitude with which some of the ETFs are fluctuating regarding their positions above or below their respective individual trend lines (%+/-M/A). A break below, represented by a negative number, shows weakness, while a break above, represented by a positive percentage, shows strength.
For hundreds of ETF choices, be sure to reference Thursday’s StatSheet.
For this current domestic “Buy” cycle, here’s how some our candidates have fared:
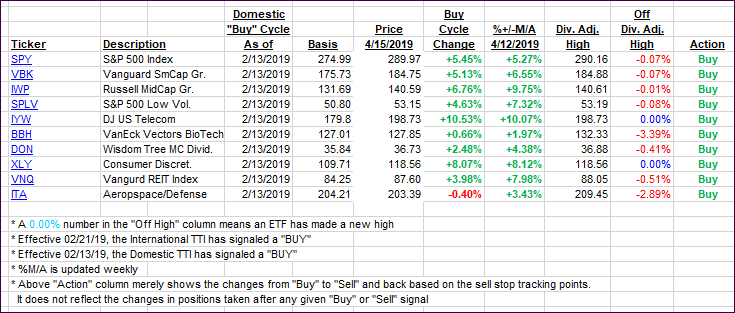
Again, the %+/-M/A column above shows the position of the various ETFs in relation to their respective long-term trend lines, while the trailing sell stops are being tracked in the “Off High” column. The “Action” column will signal a “Sell” once the -8% point has been taken out in the “Off High” column. For more volatile sector ETFs, the trigger point is -10%.
- Trend Tracking Indexes (TTIs)
Our Trend Tracking Indexes (TTIs) were mixed again with the Domestic one slightly dropping, while the International one managed to eke out a small gain.
Here’s how we closed 04/15/2019:
Domestic TTI: +6.32% above its M/A (last close +6.62%)—Buy signal effective 02/13/2019
International TTI: +3.82% above its M/A (last close +3.79%)—Buy signal effective 02/21/2019
Disclosure: I am obliged to inform you that I, as well as my advisory clients, own some of the ETFs listed in the above table. Furthermore, they do not represent a specific investment recommendation for you, they merely show which ETFs from the universe I track are falling within the specified guidelines.
Contact Ulli