
- Moving the markets
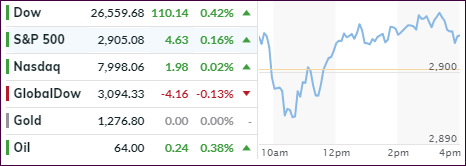
The major indexes, led by the Dow, made another attempt at breaking into record territory but failed with upward momentum lacking. Trading volume was the lowest in months meaning there was not much conviction to drive the markets higher. The theme was a repeat of what we’ve seen over the past five trading day with the direction being more sideways than up.
To wit, here’s what the S&P 500 did: 2,907, 2,906, 2,907, 2,900, 2,905.
That is not exactly a representation of a bullish market but more of one with questionable durability. Or, it could simply be a matter of Wall Street having the Easter Holiday blues. Be that as it may, next week all traders should be back on the job, and we will see if “buy” or “sell” buttons will be pushed.
Healthcare and Small Caps suffered the most this week, while the tech sector continued its role as the best performer of the year. The only potential fly in the ointment is that tech has now reached 19.2 times forward 12-months earnings, a level that was last seen in 2007, as ZH pointed out.
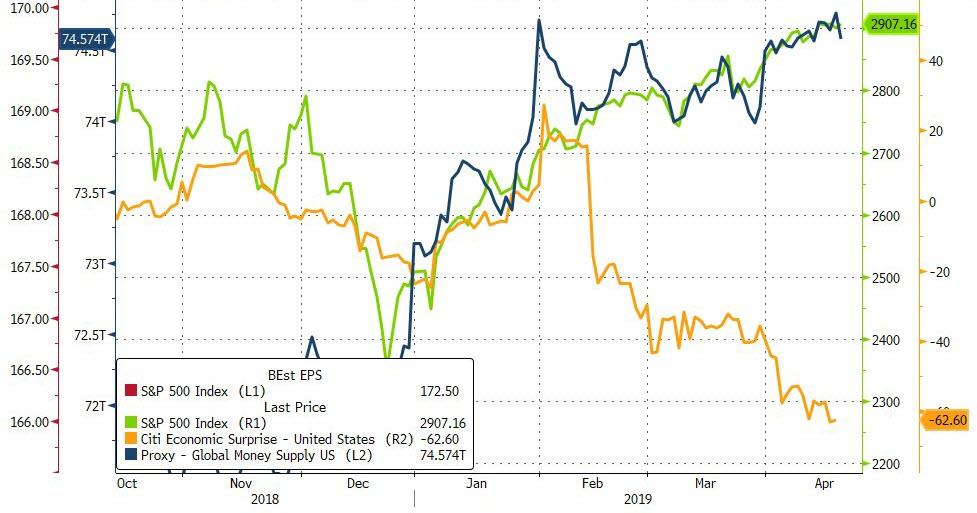
Looking at the big picture, I never get tired of looking at this chart, which demonstrates the discrepancy between the Economic Surprise Index and the S&P 500. Today, one line has been added, namely the Global Money Supply, which clearly shows who is behind the ferocious rebound from the December 2018 lows.
Makes you wonder how long this can go on, doesn’t it?
Enjoy the Easter weekend.
- ETFs in the Spotlight
In case you missed the announcement and description of this section, you can read it here again.
It features 10 broadly diversified and sector ETFs from my HighVolume list as posted every Saturday. Furthermore, they are screened for the lowest MaxDD% number meaning they have been showing better resistance to temporary sell offs than all others over the past year.
The below table simply demonstrates the magnitude with which some of the ETFs are fluctuating regarding their positions above or below their respective individual trend lines (%+/-M/A). A break below, represented by a negative number, shows weakness, while a break above, represented by a positive percentage, shows strength.
For hundreds of ETF choices, be sure to reference Thursday’s StatSheet.
For this current domestic “Buy” cycle, here’s how some our candidates have fared:
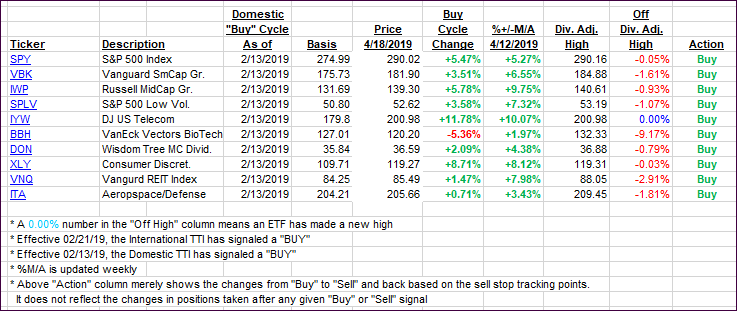
Again, the %+/-M/A column above shows the position of the various ETFs in relation to their respective long-term trend lines, while the trailing sell stops are being tracked in the “Off High” column. The “Action” column will signal a “Sell” once the -8% point has been taken out in the “Off High” column. For more volatile sector ETFs, the trigger point is -10%.
- Trend Tracking Indexes (TTIs)
Our Trend Tracking Indexes (TTIs) were mixed again, but today the Domestic one gained while the International one lost a tad.
Here’s how we closed 04/18/2019:
Domestic TTI: +5.87% above its M/A (last close +5.74%)—Buy signal effective 02/13/2019
International TTI: +4.22% above its M/A (last close +4.38%)—Buy signal effective 02/21/2019
Disclosure: I am obliged to inform you that I, as well as my advisory clients, own some of the ETFs listed in the above table. Furthermore, they do not represent a specific investment recommendation for you, they merely show which ETFs from the universe I track are falling within the specified guidelines.
Contact Ulli