
- Moving the markets
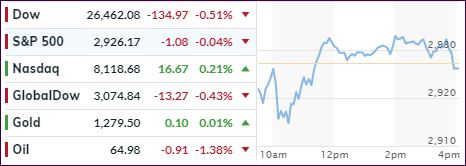
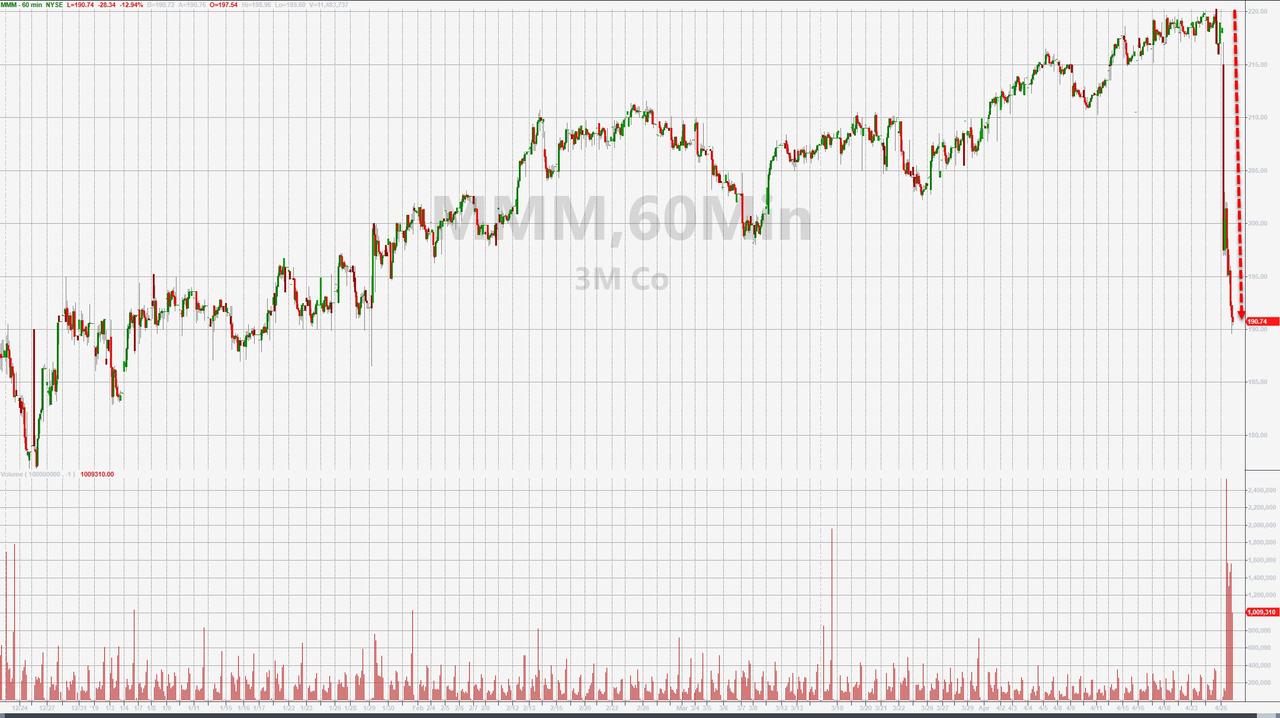
The markets came under pressure this morning with the Dow dropping some 250 points right at the opening. 3M was the contributor to this downside move as earnings disappointed, but more importantly, the company slashed forward guidance for 2019 and reduced its workforce by 2,000. The punishment was immediate with the stock skidding some 13%, its worst day since 1987’s Black Monday.
While the Dow bounced back, thanks to dip-buying rescuers, the index fared the worst of the 3 major ones by losing -0.51%. The Nasdaq closed slightly in the green, and the S&P hugged its unchanged line throughout the day but gave back a fraction in the end.
While we’ve seen a decent advance in equities this week, there are mounting signs of economic weakness throughout the world, ranging from Europe to Australia where rate cut expectations have increased. The Bank of Canada and the Bank of Japan are both projected to assume a more dovish stance (lower rates) in preparation of combating a further slowing of economic activity.
Domestically, we saw initial jobless claims surge the most in 18 months, thereby wiping out the drop we saw over the past 5 weeks. Does that mean we are now seeing the “real” and not seasonally adjusted economy appear on the horizon?
Again, bond yields ticked down causing a more favorable close to the low volatility SPLV vs. its more aggressive cousin SPY. See yesterday’s post for details.
- ETFs in the Spotlight
In case you missed the announcement and description of this section, you can read it here again.
It features 10 broadly diversified and sector ETFs from my HighVolume list as posted every Saturday. Furthermore, they are screened for the lowest MaxDD% number meaning they have been showing better resistance to temporary sell offs than all others over the past year.
The below table simply demonstrates the magnitude with which some of the ETFs are fluctuating regarding their positions above or below their respective individual trend lines (%+/-M/A). A break below, represented by a negative number, shows weakness, while a break above, represented by a positive percentage, shows strength.
For hundreds of ETF choices, be sure to reference Thursday’s StatSheet.
For this current domestic “Buy” cycle, here’s how some our candidates have fared:
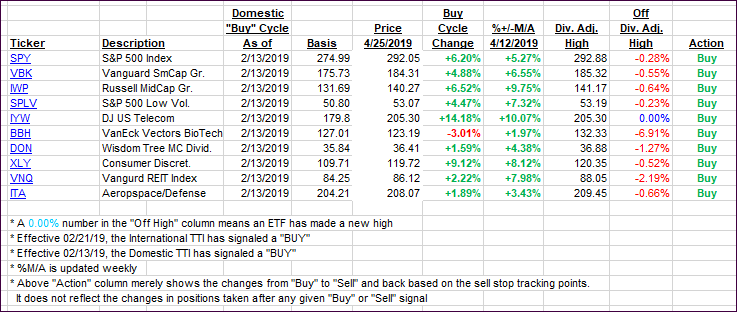
Again, the %+/-M/A column above shows the position of the various ETFs in relation to their respective long-term trend lines, while the trailing sell stops are being tracked in the “Off High” column. The “Action” column will signal a “Sell” once the -8% point has been taken out in the “Off High” column. For more volatile sector ETFs, the trigger point is -10%.
- Trend Tracking Indexes (TTIs)
Our Trend Tracking Indexes (TTIs) slipped, as the markets were stuck in a sideways to down pattern.
Here’s how we closed 04/25/2019:
Domestic TTI: +5.93% above its M/A (last close +6.55%)—Buy signal effective 02/13/2019
International TTI: +3.56% above its M/A (last close +3.83%)—Buy signal effective 02/21/2019
Disclosure: I am obliged to inform you that I, as well as my advisory clients, own some of the ETFs listed in the above table. Furthermore, they do not represent a specific investment recommendation for you, they merely show which ETFs from the universe I track are falling within the specified guidelines.
Contact Ulli