
ETF Tracker StatSheet
ENDING THE WEEK ON A BULLISH NOTE
- Moving the markets
The much-anticipated March payroll report turned out better than hoped for with the BLS reporting that the US added 196k in payrolls in March, which was a tad higher than the 177k expected. This has analysts now proclaiming that February’s dismal gain of 20k, which was upwardly revised to 33k, was an outlier and that we have “normalized.”
While the headline print was all that the computer algos cared about, there was some weakness under the hood especially in manufacturing, shopping and a lower than expected average hourly earnings number. If you care to, you can read the details here.
Zero Hedge quipped:
So where was the Growth? Here are the three key sectors:
- Professional technical services: +34K, mostly computer systems design (+11.5K)
- Healthcare: +61K
- Food Services: +27K
In other words, Americans are eating themselves into obesity, at which point they need constant medical supervision. The good news: at least the American food epidemic will provide waiter/bartender and medical jobs for a long time to come.
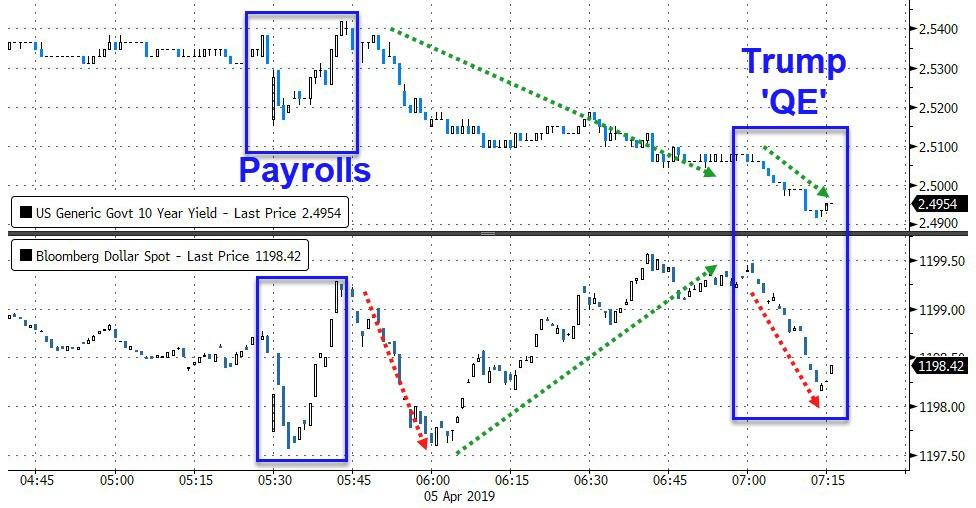
While there was no long-term effect on equities, Trump temporarily caused a bit of confusion when he slammed the Central Bank by commenting:
“I personally think the Fed should drop rates, I think they really slowed us down, there’s no inflation, in terms of quantitative tightening, it should really be quantitative easing…you would see a rocket ship. Despite that, we’re doing very well.”
Hmm, this sounds just about the opposite from his tweet on 9/29/2011:
“The Fed’s reckless policies of low interest and flooding the market with dollars needs to be stopped or we will face record inflation.”
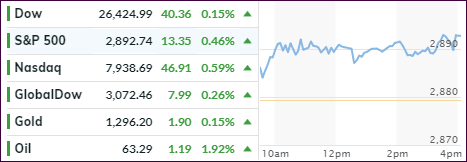
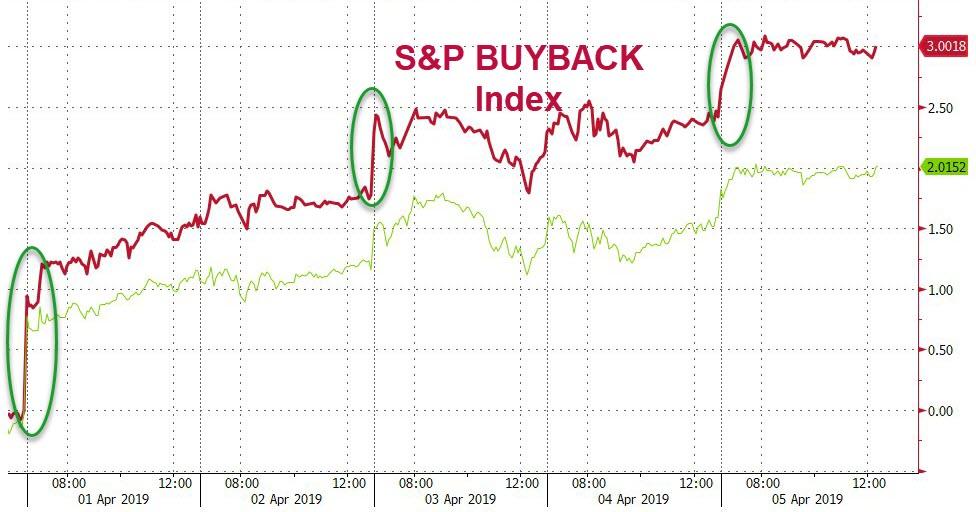
Be that as it may, the markets took it in stride with equities inching up and the S&P 500 closing at its high of the session. The biggest short squeeze in 2 weeks, along with Buybacks, added to bullish sentiment.
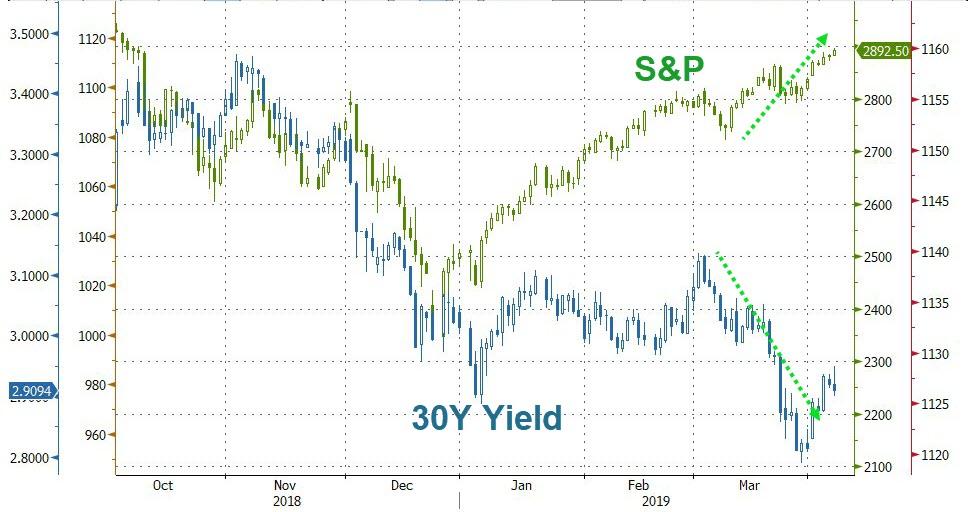
Still, the jaws of reality between stocks and bond yields paint a different picture and are widening every day. Sooner or later there will be an adjustment to bring this out of sync oddity back to normal.
The spread is currently some 500 S&P points, which means that a 20% drop of the index is required to normalize this relationship. To me, it’s not a question of “if” this happens but “when.”
- ETFs in the Spotlight
In case you missed the announcement and description of this section, you can read it here again.
It features 10 broadly diversified and sector ETFs from my HighVolume list as posted every Saturday. Furthermore, they are screened for the lowest MaxDD% number meaning they have been showing better resistance to temporary sell offs than all others over the past year.
The below table simply demonstrates the magnitude with which some of the ETFs are fluctuating regarding their positions above or below their respective individual trend lines (%+/-M/A). A break below, represented by a negative number, shows weakness, while a break above, represented by a positive percentage, shows strength.
For hundreds of ETF choices, be sure to reference Thursday’s StatSheet.
For this current domestic “Buy” cycle, here’s how some our candidates have fared:
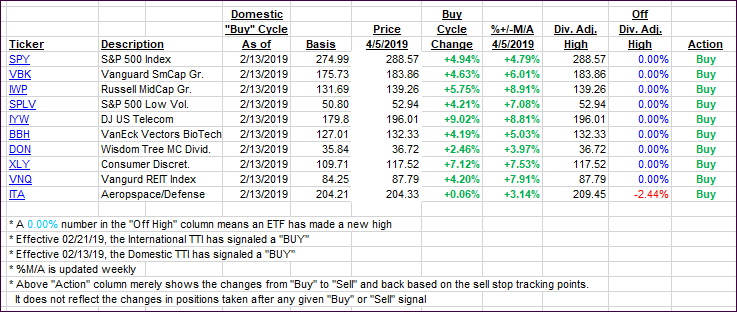
Again, the %+/-M/A column above shows the position of the various ETFs in relation to their respective long-term trend lines, while the trailing sell stops are being tracked in the “Off High” column. The “Action” column will signal a “Sell” once the -8% point has been taken out in the “Off High” column. For more volatile sector ETFs, the trigger point is -10%.
- Trend Tracking Indexes (TTIs)
Our Trend Tracking Indexes (TTIs) advanced again as the bulls had a successful week.
Here’s how we closed 04/05/2019:
Domestic TTI: +6.01% above its M/A (last close +5.48%)—Buy signal effective 02/13/2019
International TTI: +3.58% above its M/A (last close +3.39%)—Buy signal effective 02/21/2019
Disclosure: I am obliged to inform you that I, as well as my advisory clients, own some of the ETFs listed in the above table. Furthermore, they do not represent a specific investment recommendation for you, they merely show which ETFs from the universe I track are falling within the specified guidelines.
———————————————————-
WOULD YOU LIKE TO HAVE YOUR INVESTMENTS PROFESSIONALLY MANAGED?
Do you have the time to follow our investment plans yourself? If you are a busy professional who would like to have his portfolio managed using our methodology, please contact me directly or get more details at:
https://theetfbully.com/personal-investment-management/
———————————————————
Back issues of the ETF/No Load Fund Tracker are available on the web at:
https://theetfbully.com/newsletter-archives/
Contact Ulli