
ETF Tracker StatSheet
Bank Earnigns Stoke Markets
- Moving the markets
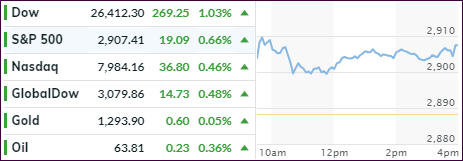
Yesterday’s uneasiness about the upcoming earnings season vanished this morning, as healthy results by JP Morgan boosted confidence in the economy in general, at least that’s how the computer algos reacted.
On the other side, Wells Fargo’s results were in line, but the mortgage side of their business continued to suffer with those numbers being the worst since the Financial Crisis.
Keep in mind, however, that it’s still too early to make any judgment as to how this earnings season will unfold. Expectations have been lowered, so it’s much easier for companies to beat them, which does not mean that the economy is on the mend.
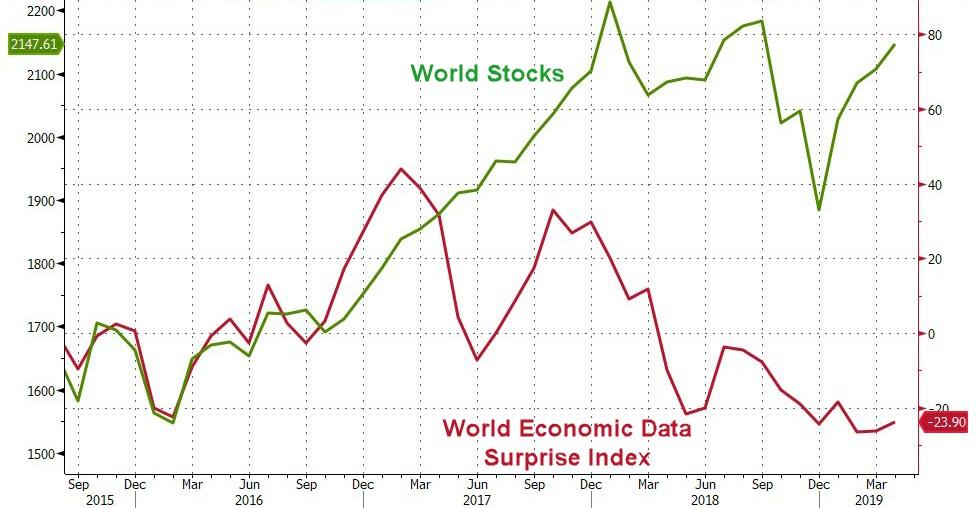
Remember, markets do not represent the economy, as this chart clearly demonstrates.
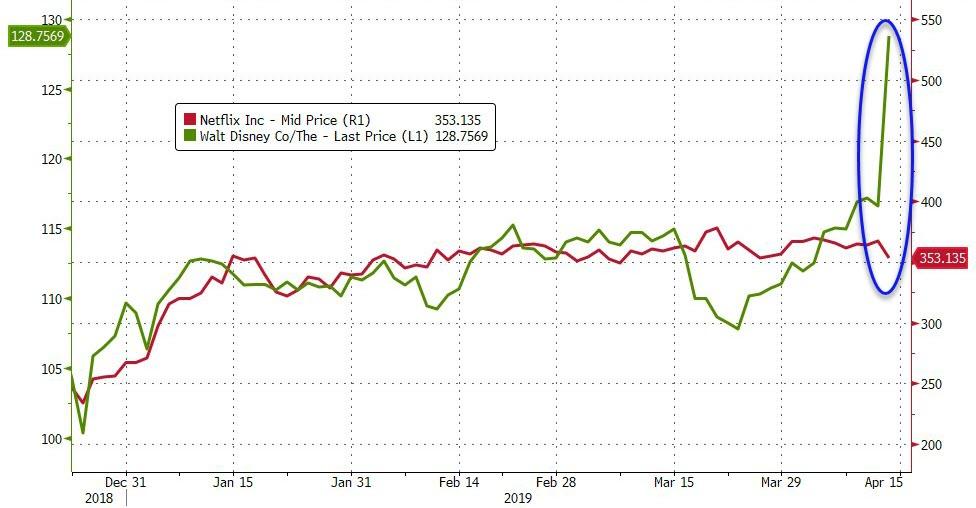
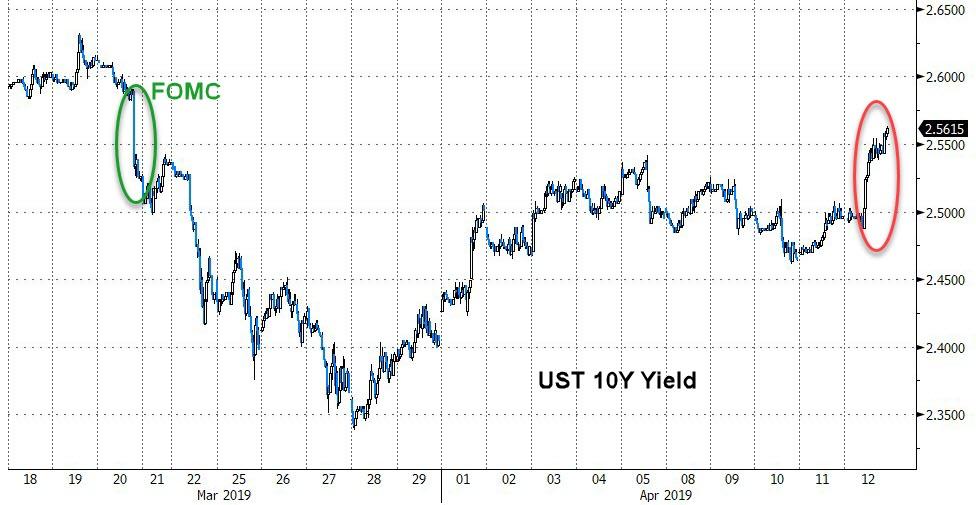
Disney’s announcement about a new streaming service helped the Dow, and the markets overall, but sent competitor Netflix south. Interestingly, heading further north were bond yields with the 10-year closing up 6 basis points to end the session at 2.56%. They have now reached the level they had before the last dovish FOMC meeting, which was the main contributor to the recent rally.
Be that as it may, the major indexes rallied across the board with the S&P 500 managing to regain its 2,900 level. Any more decent earnings news and odds are increasing that the index will take out its 2018 highs (2,941).
- ETFs in the Spotlight
In case you missed the announcement and description of this section, you can read it here again.
It features 10 broadly diversified and sector ETFs from my HighVolume list as posted every Saturday. Furthermore, they are screened for the lowest MaxDD% number meaning they have been showing better resistance to temporary sell offs than all others over the past year.
The below table simply demonstrates the magnitude with which some of the ETFs are fluctuating regarding their positions above or below their respective individual trend lines (%+/-M/A). A break below, represented by a negative number, shows weakness, while a break above, represented by a positive percentage, shows strength.
For hundreds of ETF choices, be sure to reference Thursday’s StatSheet.
For this current domestic “Buy” cycle, here’s how some our candidates have fared:
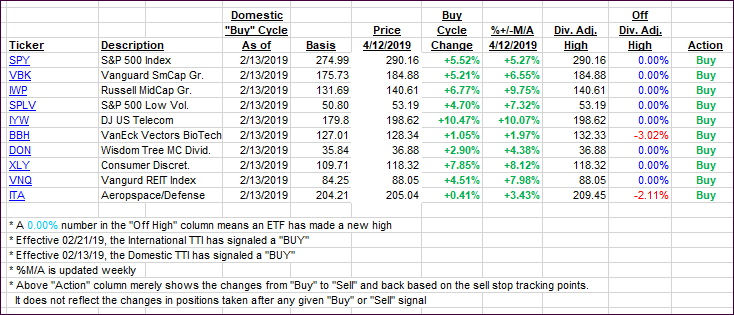
Again, the %+/-M/A column above shows the position of the various ETFs in relation to their respective long-term trend lines, while the trailing sell stops are being tracked in the “Off High” column. The “Action” column will signal a “Sell” once the -8% point has been taken out in the “Off High” column. For more volatile sector ETFs, the trigger point is -10%.
- Trend Tracking Indexes (TTIs)
Our Trend Tracking Indexes (TTIs) jumped as the bullish mood, thanks to JP Morgan’s good earnings, supported our positions.
Here’s how we closed 04/12/2019:
Domestic TTI: +6.62% above its M/A (last close +5.90%)—Buy signal effective 02/13/2019
International TTI: +3.79% above its M/A (last close +3.26%)—Buy signal effective 02/21/2019
Disclosure: I am obliged to inform you that I, as well as my advisory clients, own some of the ETFs listed in the above table. Furthermore, they do not represent a specific investment recommendation for you, they merely show which ETFs from the universe I track are falling within the specified guidelines.
———————————————————-
WOULD YOU LIKE TO HAVE YOUR INVESTMENTS PROFESSIONALLY MANAGED?
Do you have the time to follow our investment plans yourself? If you are a busy professional who would like to have his portfolio managed using our methodology, please contact me directly or get more details at:
https://theetfbully.com/personal-investment-management/
———————————————————
Back issues of the ETF/No Load Fund Tracker are available on the web at:
https://theetfbully.com/newsletter-archives/
Contact Ulli