
- Moving the markets
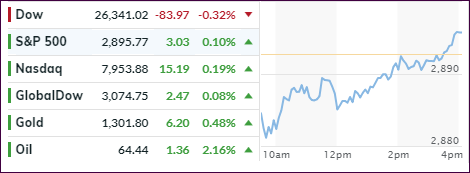
A sharp early morning drop sent the major indexes reeling before buyers stepped in and pulled the Nasdaq and S&P 500 back out of the basement and into a green close. The laggard was the Dow, because of Boeing’s production cuts, which left the index in the red.
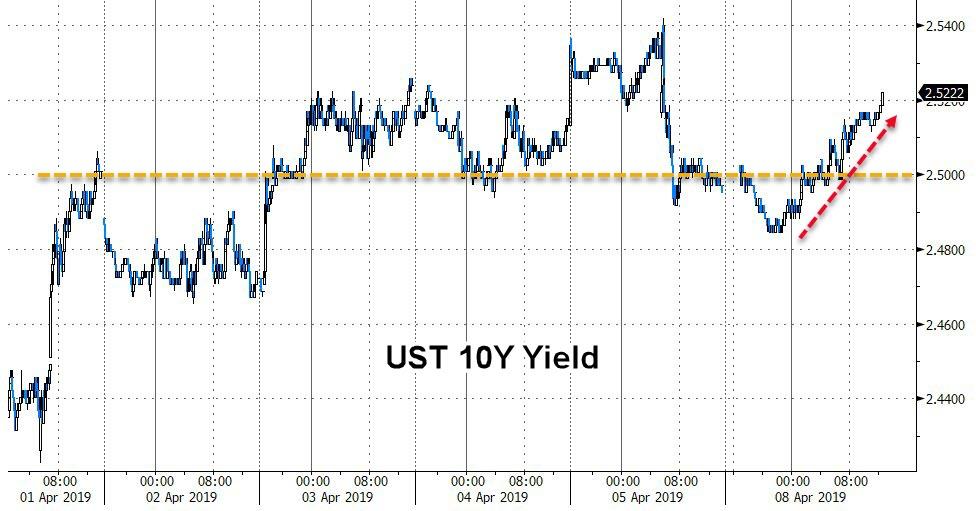
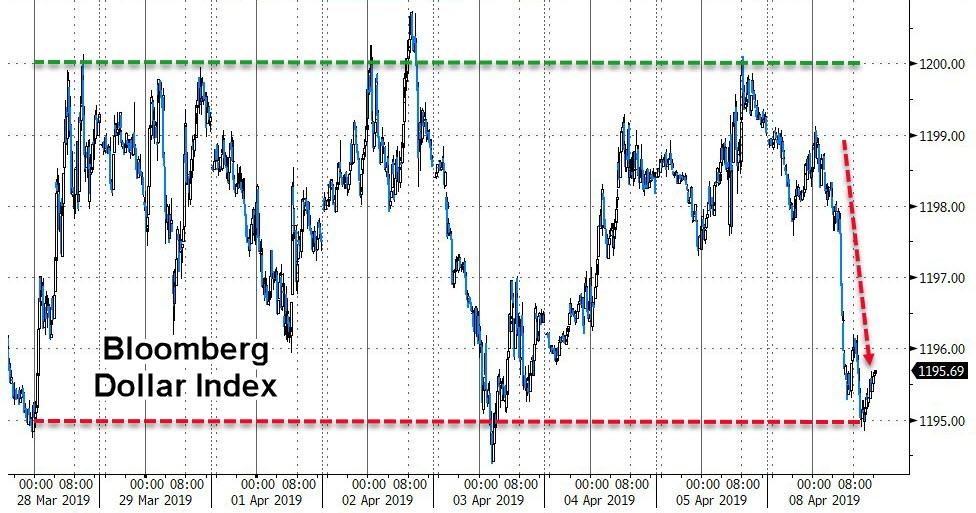
Not helping the markets were rising bond yields, which pushed the 10-year back above the 2.50% level, while the US Dollar, which usually rallies on higher rates, dumped to the low end of its recent trading range.
In the end, it was a non-eventful trading day that did not affect our Trend Tracking Indexes (TTIs) much. However, economist David Rosenberg tweeted a picture of the front cover of Barron’s magazine implying that, if you hold the view that the opposite usually happens of what major publications feature, we could be seeing the makings of a market top.
- ETFs in the Spotlight
In case you missed the announcement and description of this section, you can read it here again.
It features 10 broadly diversified and sector ETFs from my HighVolume list as posted every Saturday. Furthermore, they are screened for the lowest MaxDD% number meaning they have been showing better resistance to temporary sell offs than all others over the past year.
The below table simply demonstrates the magnitude with which some of the ETFs are fluctuating regarding their positions above or below their respective individual trend lines (%+/-M/A). A break below, represented by a negative number, shows weakness, while a break above, represented by a positive percentage, shows strength.
For hundreds of ETF choices, be sure to reference Thursday’s StatSheet.
For this current domestic “Buy” cycle, here’s how some our candidates have fared:
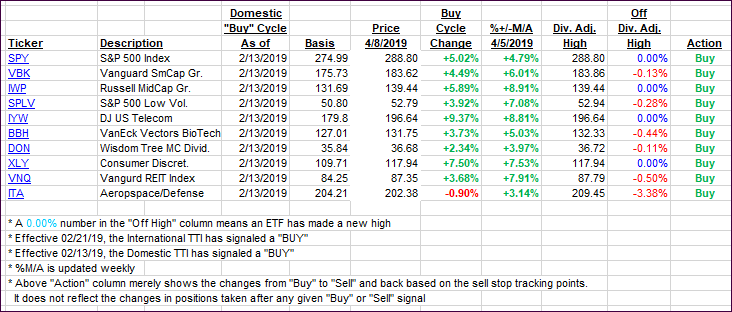
Again, the %+/-M/A column above shows the position of the various ETFs in relation to their respective long-term trend lines, while the trailing sell stops are being tracked in the “Off High” column. The “Action” column will signal a “Sell” once the -8% point has been taken out in the “Off High” column. For more volatile sector ETFs, the trigger point is -10%.
- Trend Tracking Indexes (TTIs)
Our Trend Tracking Indexes (TTIs) ticked up slightly, as the markets were busy all day crawling out of a hole.
Here’s how we closed 04/08/2019:
Domestic TTI: +6.08% above its M/A (last close +6.01%)—Buy signal effective 02/13/2019
International TTI: +3.66% above its M/A (last close +3.58%)—Buy signal effective 02/21/2019
Disclosure: I am obliged to inform you that I, as well as my advisory clients, own some of the ETFs listed in the above table. Furthermore, they do not represent a specific investment recommendation for you, they merely show which ETFs from the universe I track are falling within the specified guidelines.
Contact Ulli