
- Moving the markets
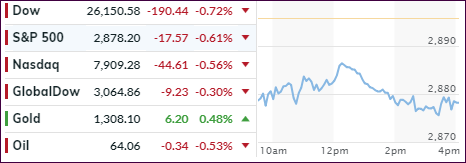
For a while, the markets looked like attempting to repeat yesterday’s feat, namely that an opening dump would be followed by a slow and steady recovery back above the unchanged line. However, mid-day the developing rebound hit a brick wall, reversed, and south we went taking out the early morning lows.
Causing this weakness was Trump’s threat to slap some $11 billion of tariffs on European Union (EU) goods, as retaliation against European subsidies for aircraft manufacturers. Considering that the trade battle with China is still unresolved, this second line of combat is seen as an additional “disrupter” of the already weakening global economies.
On the domestic economic front, we learned that job opening plunged by 538k, which was the biggest drop in 42 months. To me, that is not a surprising development given that most economic data points over the past few months have been anything but encouraging.
The stock market has been ramping higher with total disregard to underlying fundamentals, even though bond yields have been slipping and indicating that not all is well. In the meantime, the Fed has virtually guaranteed that there will be no rate hikes in 2019.
My guess is that they will likely lower rates by mid-year to stimulate activity, as the dreaded “R” word, as in recession, will likely be uttered by the Main Stream Media in the not too distant future.
Today’s pullback moved our Trend Tracking Indexes (TTIs) off their lofty levels, but they remain firmly entrenched on the bullish side of their respective trend lines (section 3).
- ETFs in the Spotlight
In case you missed the announcement and description of this section, you can read it here again.
It features 10 broadly diversified and sector ETFs from my HighVolume list as posted every Saturday. Furthermore, they are screened for the lowest MaxDD% number meaning they have been showing better resistance to temporary sell offs than all others over the past year.
The below table simply demonstrates the magnitude with which some of the ETFs are fluctuating regarding their positions above or below their respective individual trend lines (%+/-M/A). A break below, represented by a negative number, shows weakness, while a break above, represented by a positive percentage, shows strength.
For hundreds of ETF choices, be sure to reference Thursday’s StatSheet.
For this current domestic “Buy” cycle, here’s how some our candidates have fared:
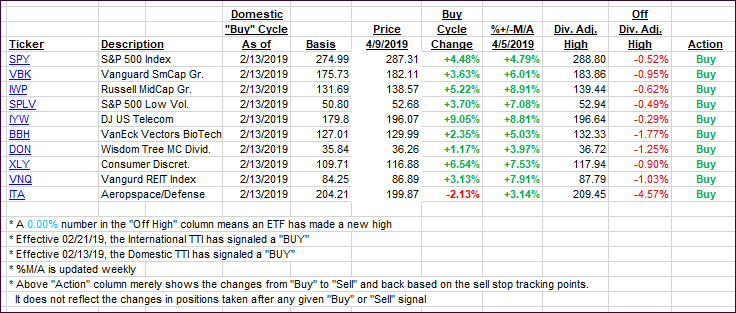
Again, the %+/-M/A column above shows the position of the various ETFs in relation to their respective long-term trend lines, while the trailing sell stops are being tracked in the “Off High” column. The “Action” column will signal a “Sell” once the -8% point has been taken out in the “Off High” column. For more volatile sector ETFs, the trigger point is -10%.
- Trend Tracking Indexes (TTIs)
Our Trend Tracking Indexes (TTIs) pulled back, as the bears had the upper hand for a change.
Here’s how we closed 04/09/2019:
Domestic TTI: +5.25% above its M/A (last close +6.08%)—Buy signal effective 02/13/2019
International TTI: +3.33% above its M/A (last close +3.66%)—Buy signal effective 02/21/2019
Disclosure: I am obliged to inform you that I, as well as my advisory clients, own some of the ETFs listed in the above table. Furthermore, they do not represent a specific investment recommendation for you, they merely show which ETFs from the universe I track are falling within the specified guidelines.
Contact Ulli