
- Moving the markets
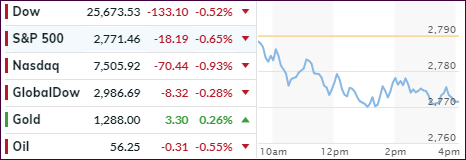
The major indexes were unable to touch the plus side of the unchanged line, as the historic Christmas rebound struggled for the second day with the S&P 500 not being able to decisively cross above its apparent glass ceiling, namely the 2,800 level.
Global markets slipped as well with investors waiting for new catalysts either from the trade arena or dovish comments from the monetary authorities. Neither was forthcoming throughout the session, so we traveled the path of least resistance, which was lower.
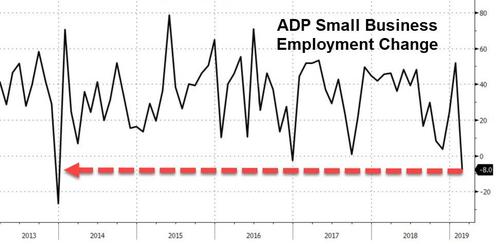
Regarding economic data, ADP reported dramatically slowing employment gains for February with the print coming in at 183k, which was slightly below the expected 190k. However, January’s gains were upwardly revised to 300k, which make the February reading even more disappointing. Small businesses noted the biggest drop in jobs since 2013.
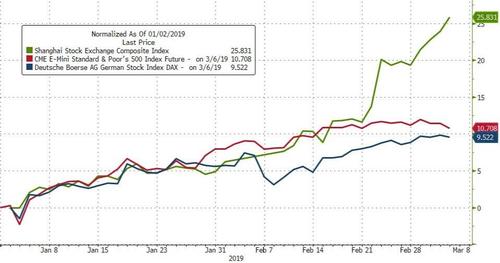
We also saw the US trade deficit soar to $621 billion, which was its highest since 2008 and is not exactly a positive for the pending U.S.-China trade negotiations. To add insult to injury, Chines equities are soaring while U.S. markets are not.
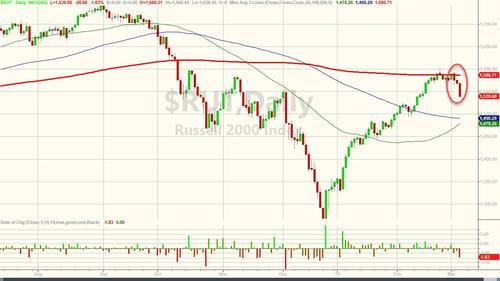
SmallCaps got spanked (3% this week) and dropped below its 200-day M/A, while Transportations were down the 9th day in a row making it its longest losing streak since February 2009. High yield credit (HYG) has dropped 5 days in a row, meaning that rates have been rising.
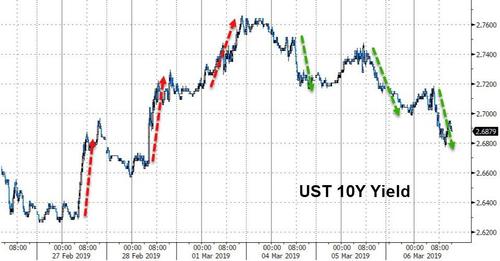
On the other hand, 10-year bond yields have been doing an about face by fading after last week’s sharp rally, but there has been no positive fallout for the stock market.
Things appear a little topsy-turvy right now, and we’ll have to wait and see which way this will play out. However, could it possibly be that global money supply, which has started to roll over, is the real culprit for this weakness in equities?
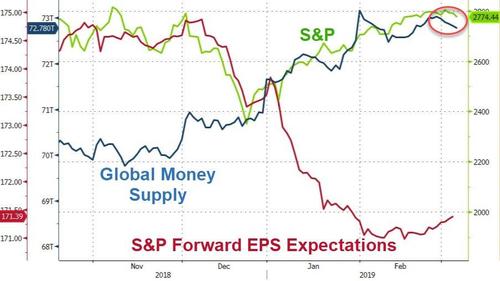
If that trend continues, watch out below.
- ETFs in the Spotlight
In case you missed the announcement and description of this section, you can read it here again.
It features 10 broadly diversified and sector ETFs from my HighVolume list as posted every Saturday. Furthermore, they are screened for the lowest MaxDD% number meaning they have been showing better resistance to temporary sell offs than all others over the past year.
The below table simply demonstrates the magnitude with which some of the ETFs are fluctuating regarding their positions above or below their respective individual trend lines (%M/A). A break below, represented by a negative number, shows weakness, while a break above, represented by a positive percentage, shows strength.
For hundreds of ETF choices, be sure to reference Thursday’s StatSheet.
Year to date, here’s how some our current candidates for this current ‘Buy’ cycle have fared:
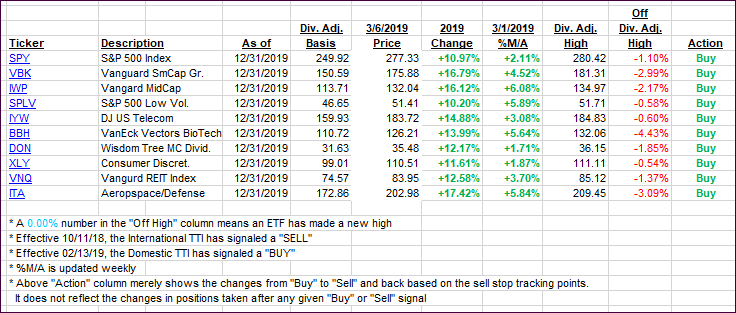
Again, the %M/A column above shows the position of the various ETFs in relation to their respective long-term trend lines, while the trailing sell stops are being tracked in the “Off High” column. The “Action” column will signal a “Sell” once the -8% point has been taken out in the “Off High” column. For more volatile sector ETFs, the trigger point is -10%.
- Trend Tracking Indexes (TTIs)
Our Trend Tracking Indexes (TTIs) headed south as weakness in equities prevailed.
Here’s how we closed 03/06/2019:
Domestic TTI: +1.88% above its M/A (last close +2.78%)—Buy signal effective 02/13/2019
International TTI: +0.64% above its M/A (last close +0.97%)—Buy signal effective 02/21/2019
Disclosure: I am obliged to inform you that I, as well as my advisory clients, own some of the ETFs listed in the above table. Furthermore, they do not represent a specific investment recommendation for you, they merely show which ETFs from the universe I track are falling within the specified guidelines.
Contact Ulli