
- Moving the markets
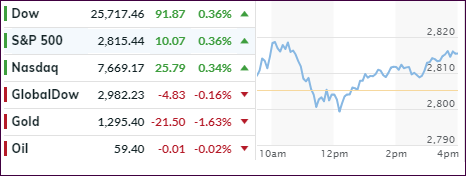
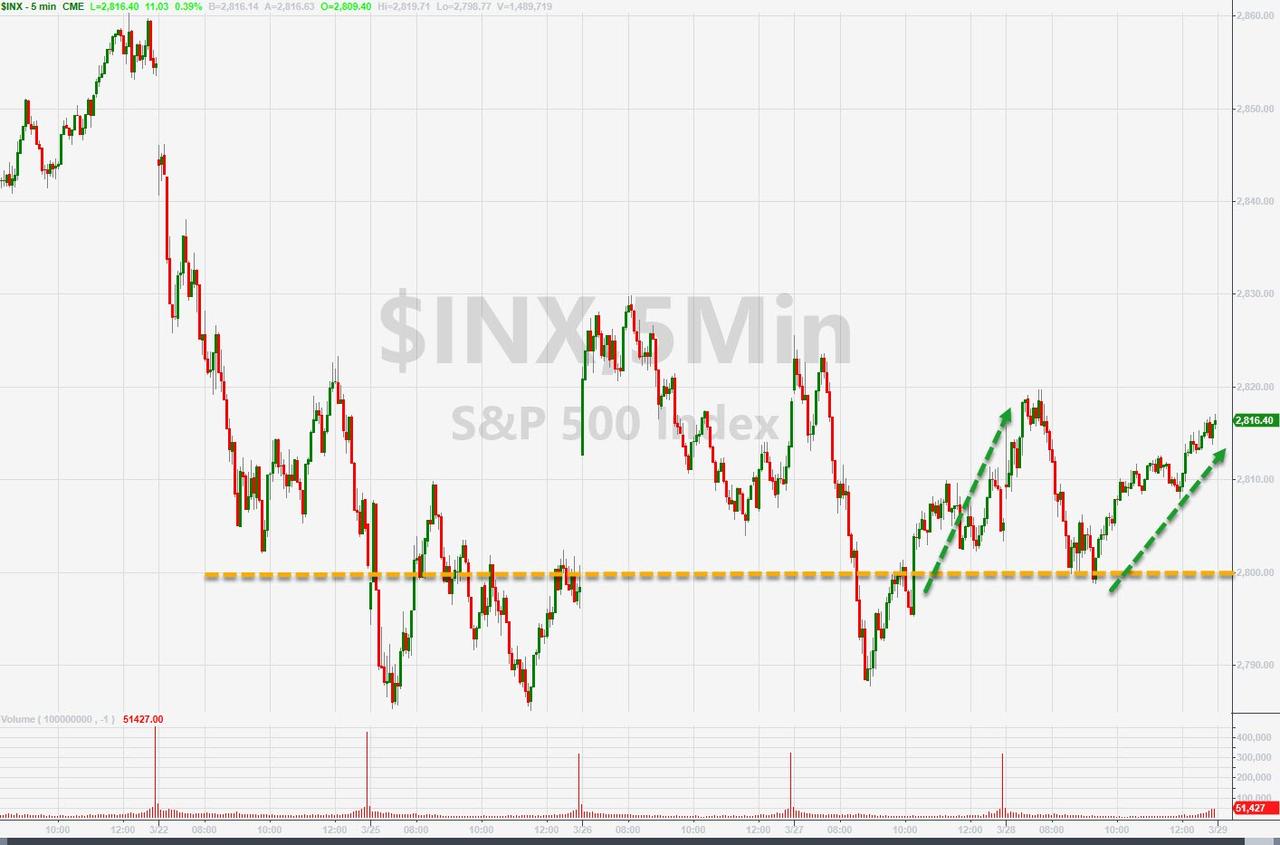
An early bounce gave way to selling with the S&P 500 touching its hard fought 2,800 level, before bullish sentiment prevailed and pulled all 3 major indexes out of the doldrums and into a green close.
Nevertheless, it was a choppy session with support coming from the dangling trade carrot which, on many occasions, has successfully supported and bailed out the bulls. Today was no different in that reports announced that “new progress toward a trade deal” had been made based on “unprecedented proposals” to resolve the long-running dispute.
Keeping the rebound in check was the revision that the U.S. economy grew at a slower 2.2% in Q4 2018 vs. the initial 2.6% estimate. However, even with this adjustment, GDP for all of 2018 came in at 2.9% matching 2015 for best performance since the Great Recession 10 years ago.
With bond yields having been clobbered, the beneficiary turned out to be mortgage rates with the 30-year now down to 4.37% on average vs. 4.54% in 2018. On the other hand, housing numbers have shown anything but greatness in that sector with the latest victim being pending home sales, which tumbled 4.9% YoY, their 14th straight month of declines.
We continue to be stuck in a sideways pattern, but I think we’ll see more clarity regarding the direction of the major trend once earnings season gets underway next week.
- ETFs in the Spotlight
In case you missed the announcement and description of this section, you can read it here again.
It features 10 broadly diversified and sector ETFs from my HighVolume list as posted every Saturday. Furthermore, they are screened for the lowest MaxDD% number meaning they have been showing better resistance to temporary sell offs than all others over the past year.
The below table simply demonstrates the magnitude with which some of the ETFs are fluctuating regarding their positions above or below their respective individual trend lines (%+/-M/A). A break below, represented by a negative number, shows weakness, while a break above, represented by a positive percentage, shows strength.
For hundreds of ETF choices, be sure to reference Thursday’s StatSheet.
For this current domestic “Buy” cycle, here’s how some our candidates have fared:
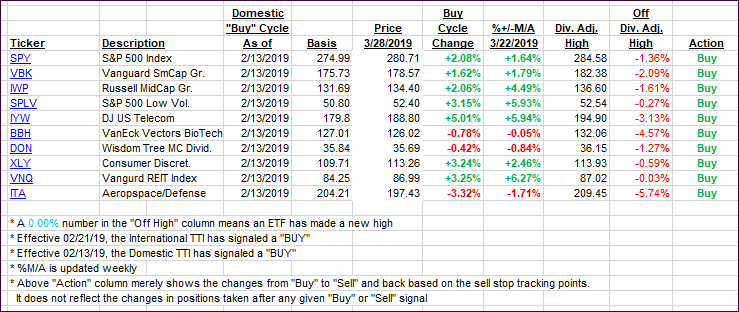
Again, the %+/-M/A column above shows the position of the various ETFs in relation to their respective long-term trend lines, while the trailing sell stops are being tracked in the “Off High” column. The “Action” column will signal a “Sell” once the -8% point has been taken out in the “Off High” column. For more volatile sector ETFs, the trigger point is -10%.
- Trend Tracking Indexes (TTIs)
Our Trend Tracking Indexes (TTIs) were mixed with the domestic one jumping and the international one sliding a tad.
Here’s how we closed 03/28/2019:
Domestic TTI: +3.07% above its M/A (last close +2.51%)—Buy signal effective 02/13/2019
International TTI: +0.62% above its M/A (last close +0.79%)—Buy signal effective 02/21/2019
Disclosure: I am obliged to inform you that I, as well as my advisory clients, own some of the ETFs listed in the above table. Furthermore, they do not represent a specific investment recommendation for you, they merely show which ETFs from the universe I track are falling within the specified guidelines.
Contact Ulli