
- Moving the markets
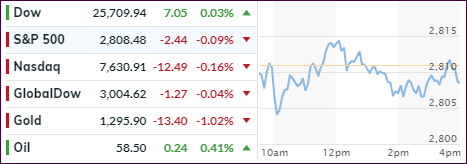
Neither bulls nor bears were able to make much headway on a day reports of stalled progress in the ongoing U.S.-China trade talks added uncertainty. The struggle to extend the 3-day winning streak lasted all day, but in the end, we closed just about unchanged.
The dialog with China was further impacted by news that the scheduled meeting between Trump and Xi Jinping had been postponed until April, a clear sign that the warring parties are nowhere near an agreement. Trump hinted that much on Wednesday by admitting that he was in no rush to strike a deal. Obviously, this has kept a lid on any possible market advances.
Concerns about the slowing global economy accelerated when China’s industrial output did not meet expectations. As the second largest economy, China is seeing an expansion that is now considered to be the slowest in some 30 years—and this is based on “official” data. Reality may be worse than currently anticipated.
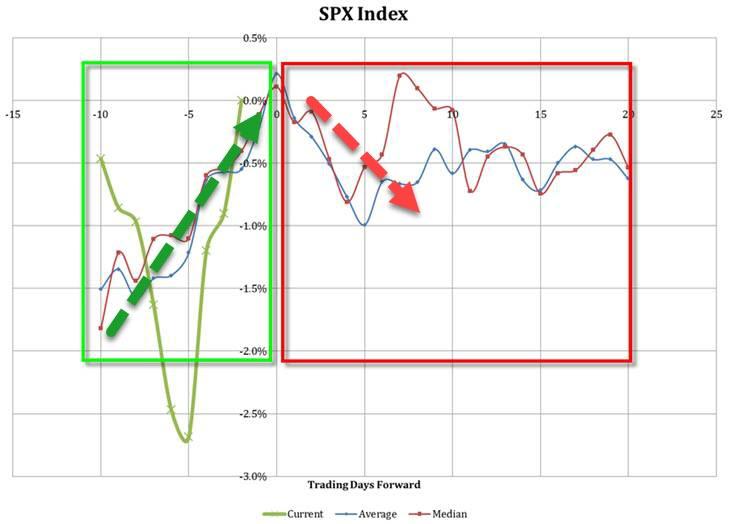
Also closely watched is the Brexit saga, with many analysts believing that a disorderly exit from the EU by Britain could agitate global markets. Some of this week’s upward momentum can also be attributed to tomorrow’s quadruple option expiration day, which historically tends to set a temporary top in the market, as this chart shows.
We’ll have to see if history repeats itself, or if the bulls can muster up enough upward momentum to push past the lurking S&P 2,817 overhead resistance level.
- ETFs in the Spotlight
In case you missed the announcement and description of this section, you can read it here again.
It features 10 broadly diversified and sector ETFs from my HighVolume list as posted every Saturday. Furthermore, they are screened for the lowest MaxDD% number meaning they have been showing better resistance to temporary sell offs than all others over the past year.
The below table simply demonstrates the magnitude with which some of the ETFs are fluctuating regarding their positions above or below their respective individual trend lines (%M/A). A break below, represented by a negative number, shows weakness, while a break above, represented by a positive percentage, shows strength.
For hundreds of ETF choices, be sure to reference Thursday’s StatSheet.
Year to date, here’s how some our current candidates for this current ‘Buy’ cycle have fared:
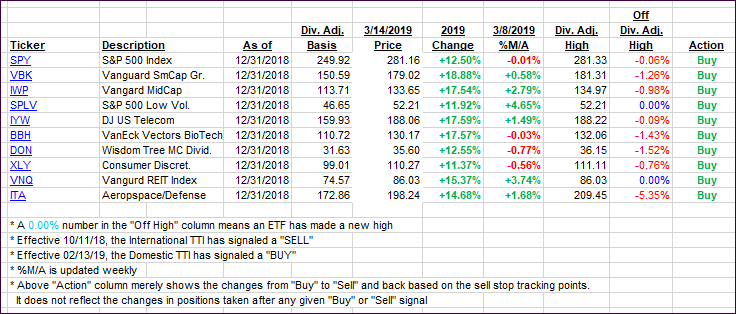
Again, the %M/A column above shows the position of the various ETFs in relation to their respective long-term trend lines, while the trailing sell stops are being tracked in the “Off High” column. The “Action” column will signal a “Sell” once the -8% point has been taken out in the “Off High” column. For more volatile sector ETFs, the trigger point is -10%.
- Trend Tracking Indexes (TTIs)
Our Trend Tracking Indexes (TTIs) pulled back a tad, as the broad market hovered around its unchanged line.
Here’s how we closed 03/14/2019:
Domestic TTI: +2.90% above its M/A (last close +3.05%)—Buy signal effective 02/13/2019
International TTI: +1.35% above its M/A (last close +1.49%)—Buy signal effective 02/21/2019
Disclosure: I am obliged to inform you that I, as well as my advisory clients, own some of the ETFs listed in the above table. Furthermore, they do not represent a specific investment recommendation for you, they merely show which ETFs from the universe I track are falling within the specified guidelines.
Contact Ulli