
- Moving the markets
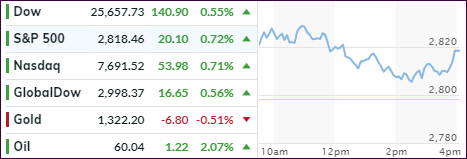
A sharp early jump in equity prices, thanks to another short squeeze, proved to be too optimistic to have staying power, so we spent the rest of the session drifting off the intraday highs. For a while it looked as if we were going to slide into the red, but thanks to sudden buying during the last 30 minutes, the major indexes reversed and closed solidly in the green.
Pulling the markets off the early highs was continued uncertainty about global growth, along with the ongoing Brexit saga. Not helping the bullish mood at all was a menu of negative data points ranging from crashing consumer confidence, slowing U.S. home price growth to poor housing starts and permits, which plunged in March.
Adding insult to injury was a ruling from a Texas district court declaring the entire ACA (Affordable Care Act) unconstitutional, a view which was shared by the U.S. Justice Department. While this so far only affected health insurance stocks, there may be more fallout in the future, should it develop into an all-out legal battle. Remember, markets hate uncertainty.
In the meantime, the yield curve inversion continued with the 3-month/10-year bonds taking the spotlight. Again, it simply means that you can invest your money in a 3-month bond and get a higher yield than in a 10-year instrument! It’s downright farcical…
- ETFs in the Spotlight
In case you missed the announcement and description of this section, you can read it here again.
It features 10 broadly diversified and sector ETFs from my HighVolume list as posted every Saturday. Furthermore, they are screened for the lowest MaxDD% number meaning they have been showing better resistance to temporary sell offs than all others over the past year.
The below table simply demonstrates the magnitude with which some of the ETFs are fluctuating regarding their positions above or below their respective individual trend lines (%+/-M/A). A break below, represented by a negative number, shows weakness, while a break above, represented by a positive percentage, shows strength.
For hundreds of ETF choices, be sure to reference Thursday’s StatSheet.
For this current domestic “Buy” cycle, here’s how some our candidates have fared:
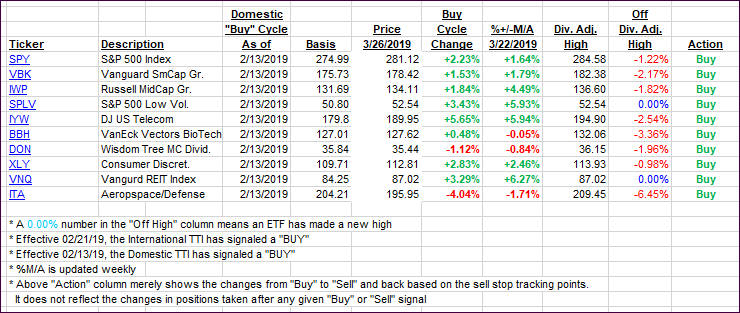
Again, the %+/-M/A column above shows the position of the various ETFs in relation to their respective long-term trend lines, while the trailing sell stops are being tracked in the “Off High” column. The “Action” column will signal a “Sell” once the -8% point has been taken out in the “Off High” column. For more volatile sector ETFs, the trigger point is -10%.
- Trend Tracking Indexes (TTIs)
Our Trend Tracking Indexes (TTIs) rose with the general market.
Here’s how we closed 03/26/2019:
Domestic TTI: +2.85% above its M/A (last close +2.00%)—Buy signal effective 02/13/2019
International TTI: 1.15% above its M/A (last close +0.60%)—Buy signal effective 02/21/2019
Disclosure: I am obliged to inform you that I, as well as my advisory clients, own some of the ETFs listed in the above table. Furthermore, they do not represent a specific investment recommendation for you, they merely show which ETFs from the universe I track are falling within the specified guidelines.
Contact Ulli