
- Moving the markets
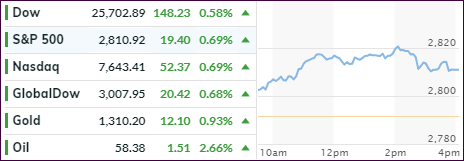
The S&P 500 made another assault at the 2,800 marker and succeeded, at least for the time being. The last time, we saw this level being conquered was on March 1st, but bullish enthusiasm waned as negative news about a possible final China-Trade deal turned out to be nothing but hot air.
Today, the climb above had more legs, as the index also touched the 2,820 level, which is above a major resistance marker (2,817), as analyzed here. However, we later faded in the session but at least managed to hold on to the magical 2,800 line in the sand.
Assisting that fade was Trump’s removal of the dangling carrot, namely the trade talks with the Chinese, by announcing that he is in “no rush” to proceed. Surprisingly, market reaction was tranquil.
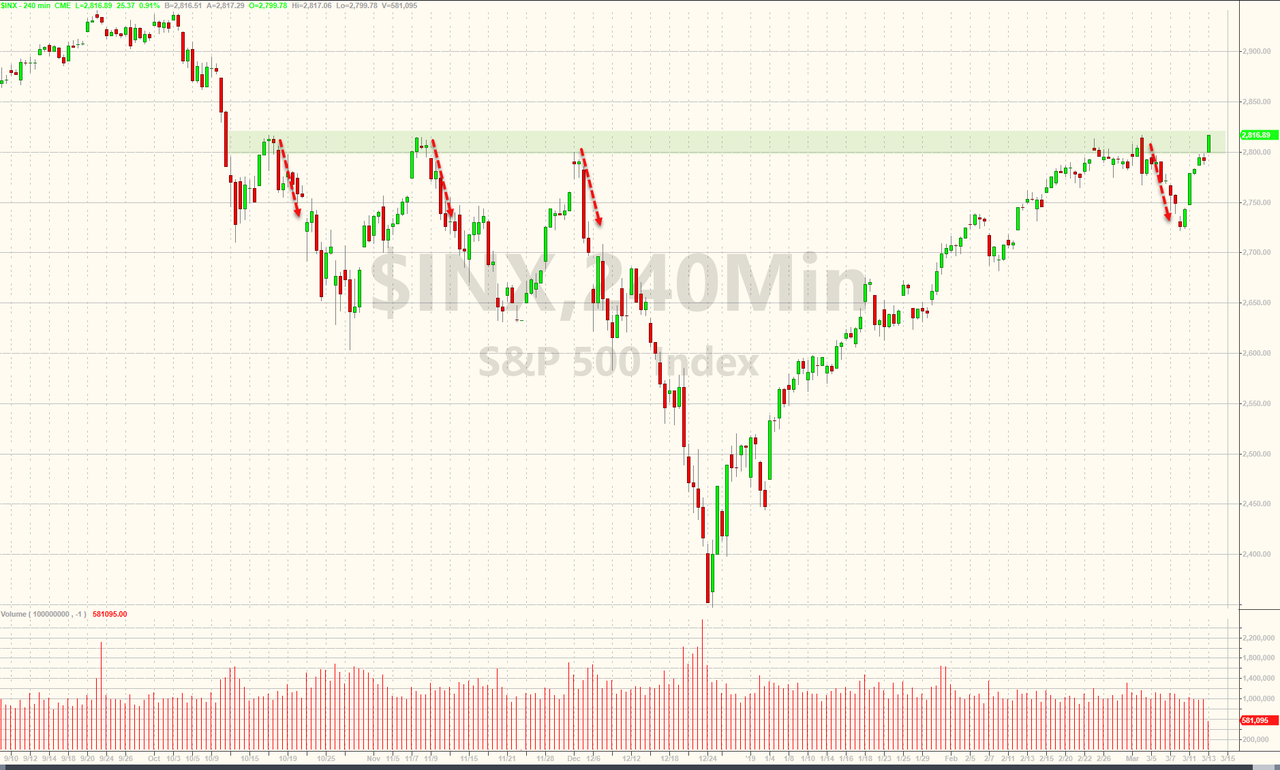
This is now the 5th test of the S&P’s 2,815/17 range since last year, as this chart shows. The prior four attempts were rebuffed, with especially the third one in October being the “nasty” one, which required engagement of the heavy artillery in form of the Fed’s policy reversal (no more rate hikes) late December.
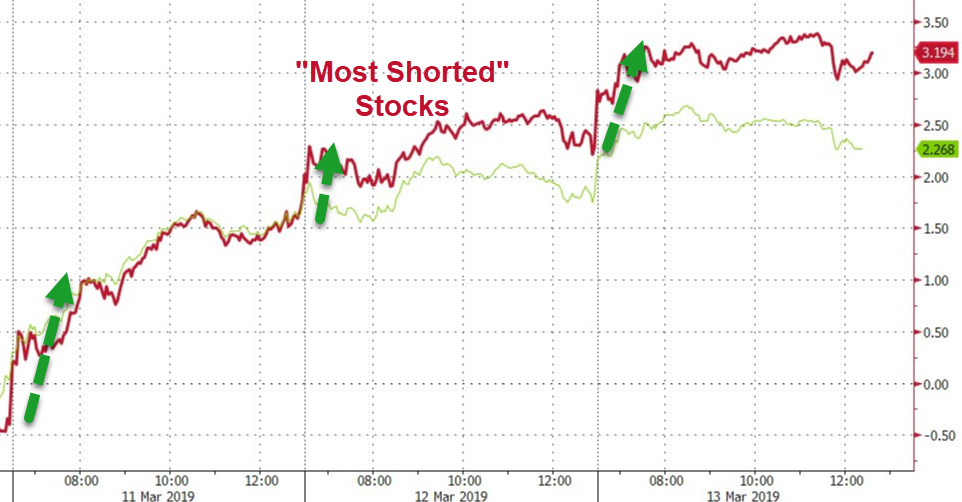
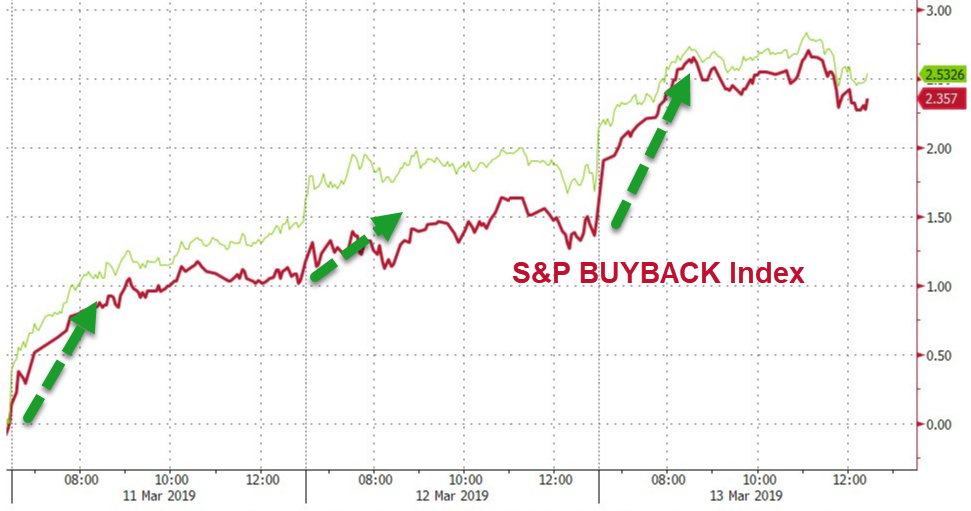
Another short squeeze and surging buyback related stocks made sure that the continued Boeing fallout did not filter down to the broad market. For right now, the bullish theme remains intact.
- ETFs in the Spotlight
In case you missed the announcement and description of this section, you can read it here again.
It features 10 broadly diversified and sector ETFs from my HighVolume list as posted every Saturday. Furthermore, they are screened for the lowest MaxDD% number meaning they have been showing better resistance to temporary sell offs than all others over the past year.
The below table simply demonstrates the magnitude with which some of the ETFs are fluctuating regarding their positions above or below their respective individual trend lines (%M/A). A break below, represented by a negative number, shows weakness, while a break above, represented by a positive percentage, shows strength.
For hundreds of ETF choices, be sure to reference Thursday’s StatSheet.
Year to date, here’s how some our current candidates for this current ‘Buy’ cycle have fared:
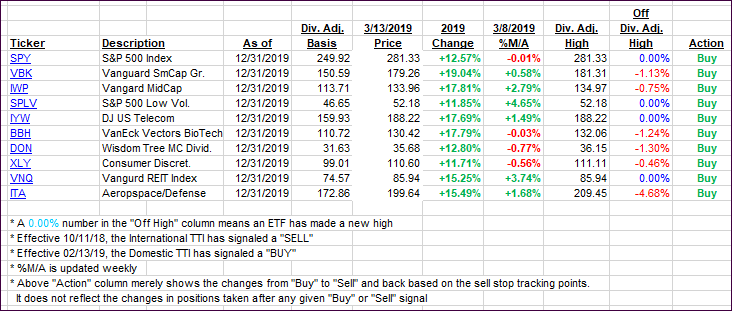
Again, the %M/A column above shows the position of the various ETFs in relation to their respective long-term trend lines, while the trailing sell stops are being tracked in the “Off High” column. The “Action” column will signal a “Sell” once the -8% point has been taken out in the “Off High” column. For more volatile sector ETFs, the trigger point is -10%.
- Trend Tracking Indexes (TTIs)
Our Trend Tracking Indexes (TTIs) jumped, as the broad market maintained its bullish bias.
Here’s how we closed 03/13/2019:
Domestic TTI: +3.05% above its M/A (last close +2.43%)—Buy signal effective 02/13/2019
International TTI: +1.49% above its M/A (last close +0.79%)—Buy signal effective 02/21/2019
Disclosure: I am obliged to inform you that I, as well as my advisory clients, own some of the ETFs listed in the above table. Furthermore, they do not represent a specific investment recommendation for you, they merely show which ETFs from the universe I track are falling within the specified guidelines.
Contact Ulli