
- Moving the markets
After an early dump, the markets stabilized mid-session, after the Fed softened its rate outlook and opined positively on the state of the economy. Some analysts likened the Fed’s statement to “folding like a cheap lawn chair,” as it dramatically slashed its stance on interest rates.
It seems, at least for the time being, that the Fed will hold rates steady this year before raising it once in 2020. If that pans out, according to ZH, it would be unprecedented:
Since the 1970s, there have been three times when the Fed held rates steady for more than a year after raising them in the precious three months: 2006, 2007 and 1997. Invariably, the next move was a rate cut.
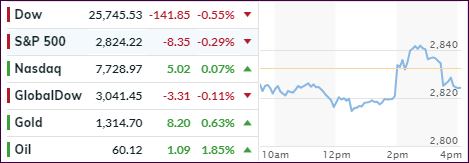
However, as I pointed out yesterday, the market has gotten “greedy” and expects a rate cut of 16 bps in 2019. With that potentially not happening, equities surged at first but then faded quickly into the close leaving only the Nasdaq in the green.
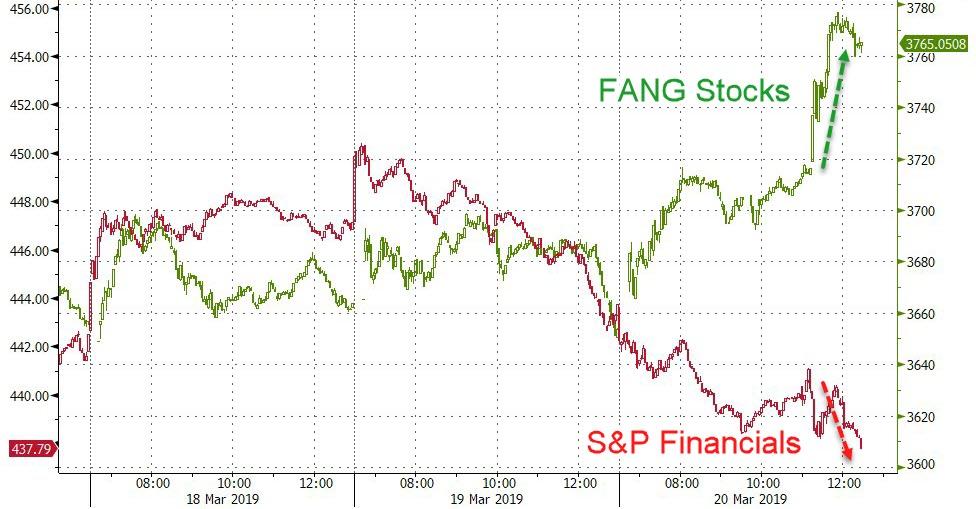
It was a tale of many markets. On one hand, FANG stocks rallied but Financials got clobbered, along with Regional Banks, which comes as no surprise given the Fed’s dovish statement.
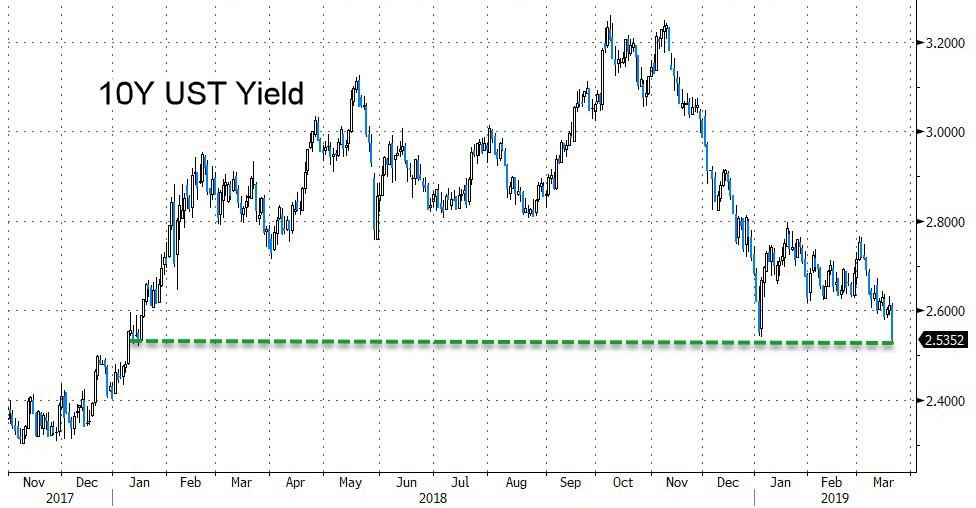
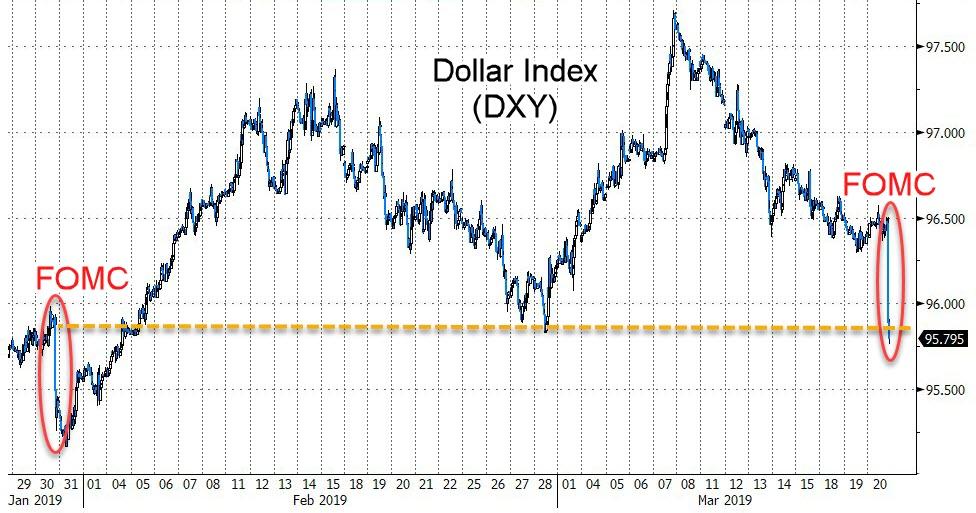
Bond yields got hammered with the 10-year now reaching 2.52%, its lowest since January 2018. The more obvious loser of the day was the U.S. Dollar, which crashed down to a level last seen early February. It has now been down 8 of the last 9 days after being up 7 days in a row. Keep in mind that lower bond yields affect the Dollar negatively.
In my advisor practice, I took advantage of the early pullback to add to our investment positions based on my assumption that the Fed would maintain its dovish bias and therefore pull the indexes out of the doldrums.
- ETFs in the Spotlight
In case you missed the announcement and description of this section, you can read it here again.
It features 10 broadly diversified and sector ETFs from my HighVolume list as posted every Saturday. Furthermore, they are screened for the lowest MaxDD% number meaning they have been showing better resistance to temporary sell offs than all others over the past year.
The below table simply demonstrates the magnitude with which some of the ETFs are fluctuating regarding their positions above or below their respective individual trend lines (%+/-M/A). A break below, represented by a negative number, shows weakness, while a break above, represented by a positive percentage, shows strength.
For hundreds of ETF choices, be sure to reference Thursday’s StatSheet.
For this current domestic “Buy” cycle, here’s how some our candidates have fared:
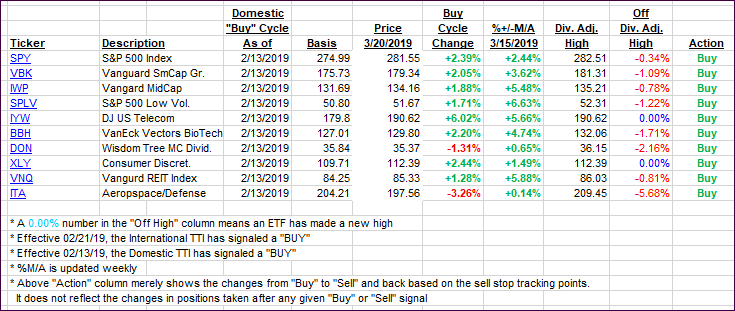
Again, the %+/-M/A column above shows the position of the various ETFs in relation to their respective long-term trend lines, while the trailing sell stops are being tracked in the “Off High” column. The “Action” column will signal a “Sell” once the -8% point has been taken out in the “Off High” column. For more volatile sector ETFs, the trigger point is -10%.
- Trend Tracking Indexes (TTIs)
Our Trend Tracking Indexes (TTIs) pulled back as the markets were mixed.
Here’s how we closed 03/20/2019:
Domestic TTI: +2.33% above its M/A (last close +3.05%)—Buy signal effective 02/13/2019
International TTI: +2.57% above its M/A (last close +2.72%)—Buy signal effective 02/21/2019
Disclosure: I am obliged to inform you that I, as well as my advisory clients, own some of the ETFs listed in the above table. Furthermore, they do not represent a specific investment recommendation for you, they merely show which ETFs from the universe I track are falling within the specified guidelines.
Contact Ulli