
- Moving the markets
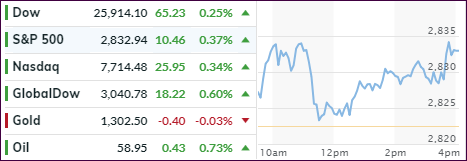
Friday’s quad-witching hour turned into a positive for equities in general while today’s market action ahead of the Fed meeting on interest rates was inconsistent but upward trending.
Most of the action happened at the opening, when a surge pushed stocks higher, which was followed by a lull throughout the session, before buyers stepped back in at the close to push the major indexes back to their morning highs.
Expectations are for the Fed, at their Wednesday meeting, to leave interest rates unchanged, but more importantly, every word presented in their final statement will be dissected and regurgitated. The goal is to analyze and figure out the Fed’s projected path on interest rates, such as one hike this year and anther one in 2020.
The hope is that the dovish and wait-and-see attitude adopted in January still has merit, because it was instrumental in pulling stocks out of the December bear market and creating this incredible rebound of 2019 that rescued the buy-and-hold crowd.
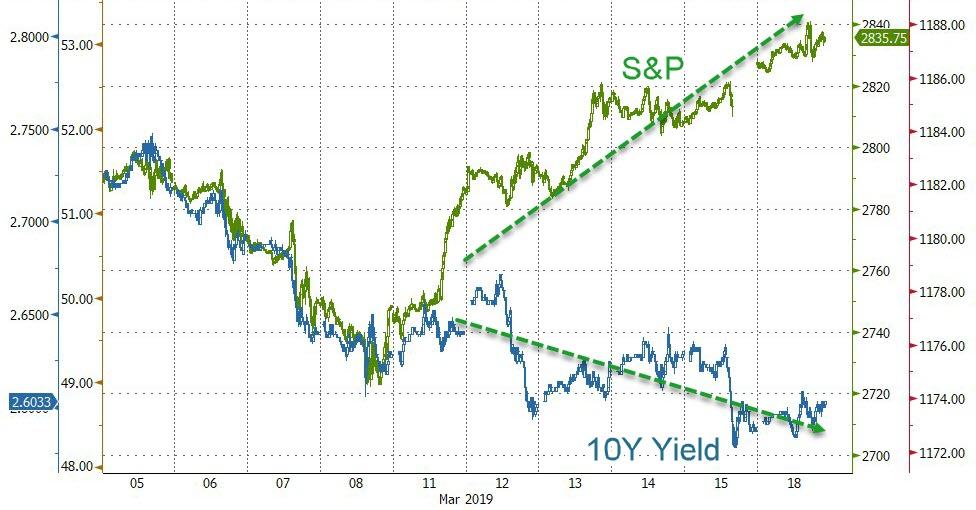
If the Fed maintains that policy, we may see more equity advances. If it doesn’t, we could see a sell-off that might retrace the 2019 gains. It would make sense to think that they will not do another policy U-turn, so the former is more likely than the latter. Still, the gap between stocks and bonds continues to widen and has reached 120 S&P points at this time.
While that may seem large to you, it would only take a ~4.2% correction on the S&P 500 to fall back in sync with the direction of bonds, which is certainly within the range of what’s acceptable.
- ETFs in the Spotlight
In case you missed the announcement and description of this section, you can read it here again.
It features 10 broadly diversified and sector ETFs from my HighVolume list as posted every Saturday. Furthermore, they are screened for the lowest MaxDD% number meaning they have been showing better resistance to temporary sell offs than all others over the past year.
The below table simply demonstrates the magnitude with which some of the ETFs are fluctuating regarding their positions above or below their respective individual trend lines (%+/-M/A). A break below, represented by a negative number, shows weakness, while a break above, represented by a positive percentage, shows strength.
For hundreds of ETF choices, be sure to reference Thursday’s StatSheet.
For this current domestic “Buy” cycle, here’s how some our candidates have fared:
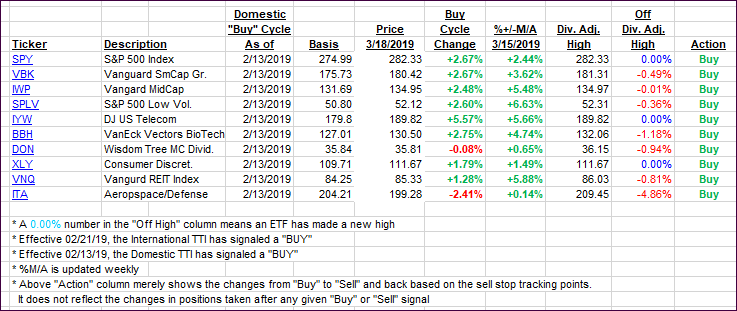
Again, the %+/-M/A column above shows the position of the various ETFs in relation to their respective long-term trend lines, while the trailing sell stops are being tracked in the “Off High” column. The “Action” column will signal a “Sell” once the -8% point has been taken out in the “Off High” column. For more volatile sector ETFs, the trigger point is -10%.
- Trend Tracking Indexes (TTIs)
Our Trend Tracking Indexes (TTIs) were mixed with the Domestic one inching up while the International one showed more strength and jumped from Friday’s close.
Here’s how we closed 03/18/2019:
Domestic TTI: +3.23% above its M/A (last close +3.22%)—Buy signal effective 02/13/2019
International TTI: +2.59% above its M/A (last close +1.98%)—Buy signal effective 02/21/2019
Disclosure: I am obliged to inform you that I, as well as my advisory clients, own some of the ETFs listed in the above table. Furthermore, they do not represent a specific investment recommendation for you, they merely show which ETFs from the universe I track are falling within the specified guidelines.
Contact Ulli