
- Moving the markets
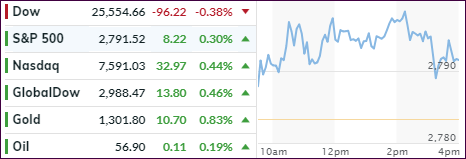
The Dow proved to be the laggard of the day again, as more fallout from Boeing’s recent aircraft crashes continued with many countries now having grounded the 737 Max jets. With Boeing (-6.22%) being a large component of the Dow, it’s no surprise that the index is suffering.
In the meantime, the S&P 500 and the Nasdaq added to yesterday’s gains with the supporting cast including health and technology sectors. The S&P appeared to be making another charge at breaking the 2,800 level to the upside but fell short of reaching that resistance level.
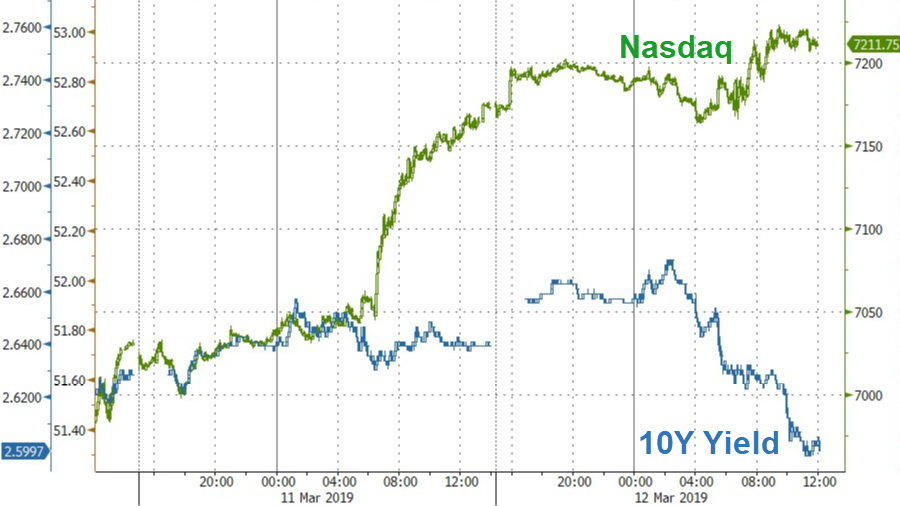
The 10-year bond yield dropped to 2.60% while the Nasdaq popped creating a divergence, which sooner or later will have to adjust. Usually, bond yields pave the way and, if history repeats itself, we will eventually see the Nasdaq attempting to head south to get back in sync with the yield.
However, right now the bulls are in control, and we will enjoy the ride for as long as it lasts.
- ETFs in the Spotlight
In case you missed the announcement and description of this section, you can read it here again.
It features 10 broadly diversified and sector ETFs from my HighVolume list as posted every Saturday. Furthermore, they are screened for the lowest MaxDD% number meaning they have been showing better resistance to temporary sell offs than all others over the past year.
The below table simply demonstrates the magnitude with which some of the ETFs are fluctuating regarding their positions above or below their respective individual trend lines (%M/A). A break below, represented by a negative number, shows weakness, while a break above, represented by a positive percentage, shows strength.
For hundreds of ETF choices, be sure to reference Thursday’s StatSheet.
Year to date, here’s how some our current candidates for this current ‘Buy’ cycle have fared:
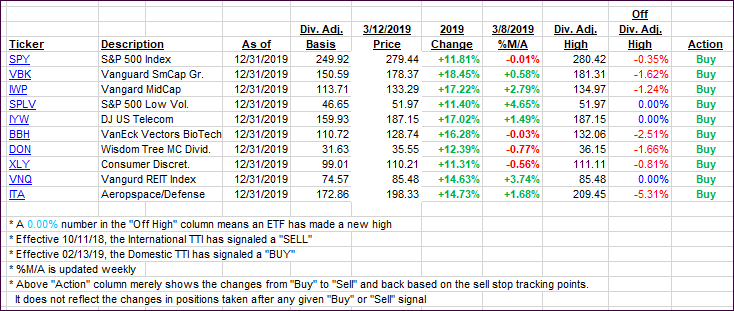
Again, the %M/A column above shows the position of the various ETFs in relation to their respective long-term trend lines, while the trailing sell stops are being tracked in the “Off High” column. The “Action” column will signal a “Sell” once the -8% point has been taken out in the “Off High” column. For more volatile sector ETFs, the trigger point is -10%.
- Trend Tracking Indexes (TTIs)
Our Trend Tracking Indexes (TTIs) headed higher as bullish momentum continued.
Here’s how we closed 03/12/2019:
Domestic TTI: +2.43% above its M/A (last close +2.10%)—Buy signal effective 02/13/2019
International TTI: +0.79% above its M/A (last close +0.41%)—Buy signal effective 02/21/2019
Disclosure: I am obliged to inform you that I, as well as my advisory clients, own some of the ETFs listed in the above table. Furthermore, they do not represent a specific investment recommendation for you, they merely show which ETFs from the universe I track are falling within the specified guidelines.
Contact Ulli