
- Moving the markets
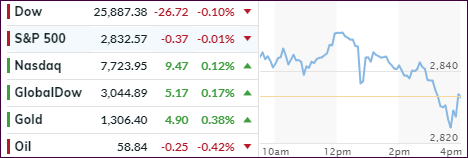
An early rally lost steam mid-day when reports (Bloomberg) surfaced that trade negotiations ran into a brick wall, as the Chinese pushed back to get more assurances on tariffs. That story was then rebuffed, as the WSJ offered a different version:
Talks between the two nations are in the final stages, said individuals tracking the negotiations, with a target date for a deal by the end of April. That is about a month later than the two sides had initially planned.
As a result, equities rebounded but momentum continued to slip with the major indexes ending up closing at their respective unchanged lines. Of course, motivation, or lack thereof, in anticipation of tomorrow’s Fed announcement on interest rates, played a role as well in traders’ minds to not make too aggressive of a commitment.
Transportations (IYT) were the ugly duckling of the day by shedding -1.39%, but YTD the index is up solidly. The Dow “lost” its 26k marker but should be able to regain it if the Fed does not disappoint.
And that is the big question du jour. ZH commented that markets have priced in 16 basis points of rate cuts for 2019, which to me means that Fed head Powell must present a very dovish viewpoint tomorrow to even have a chance to “please” the markets.
- ETFs in the Spotlight
In case you missed the announcement and description of this section, you can read it here again.
It features 10 broadly diversified and sector ETFs from my HighVolume list as posted every Saturday. Furthermore, they are screened for the lowest MaxDD% number meaning they have been showing better resistance to temporary sell offs than all others over the past year.
The below table simply demonstrates the magnitude with which some of the ETFs are fluctuating regarding their positions above or below their respective individual trend lines (%+/-M/A). A break below, represented by a negative number, shows weakness, while a break above, represented by a positive percentage, shows strength.
For hundreds of ETF choices, be sure to reference Thursday’s StatSheet.
For this current domestic “Buy” cycle, here’s how some our candidates have fared:
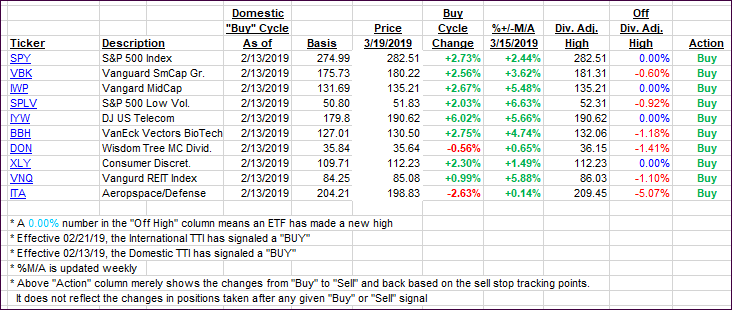
Again, the %+/-M/A column above shows the position of the various ETFs in relation to their respective long-term trend lines, while the trailing sell stops are being tracked in the “Off High” column. The “Action” column will signal a “Sell” once the -8% point has been taken out in the “Off High” column. For more volatile sector ETFs, the trigger point is -10%.
- Trend Tracking Indexes (TTIs)
Our Trend Tracking Indexes (TTIs) were mixed with today the International one gaining while the Domestic one slipped.
Here’s how we closed 03/19/2019:
Domestic TTI: +3.05% above its M/A (last close +3.23%)—Buy signal effective 02/13/2019
International TTI: +2.72% above its M/A (last close +2.59%)—Buy signal effective 02/21/2019
Disclosure: I am obliged to inform you that I, as well as my advisory clients, own some of the ETFs listed in the above table. Furthermore, they do not represent a specific investment recommendation for you, they merely show which ETFs from the universe I track are falling within the specified guidelines.
Contact Ulli