
- Moving the markets
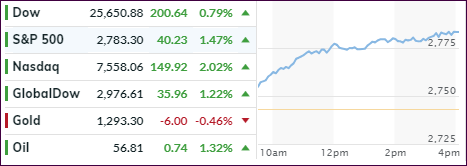
Despite early weakness, the Dow managed a nice turnaround by coming back from a 240 point deficit to a 200-point gain. Boeing was the company that kept the Dow in check, after it fell some -6.5% caused by the second deadly airline crash in six months involving the 737 Max 8 planes.
The S&P 500 and the Nasdaq raced ahead with the latter being the clear winner for the day. Both managed to regain their respective 200-day M/As, but the S&P fell short of breaking through its overhead 2,800 glass ceiling.
Still, today was a solid rebound, after last week’s sell-off, propelled by today’s retail sales number, which was decent considering December’s disaster. Assisting the bullish mood was Fed chief Powell’s appearance on 60 minutes last night, which was generally perceived as “reassuringly” dovish.
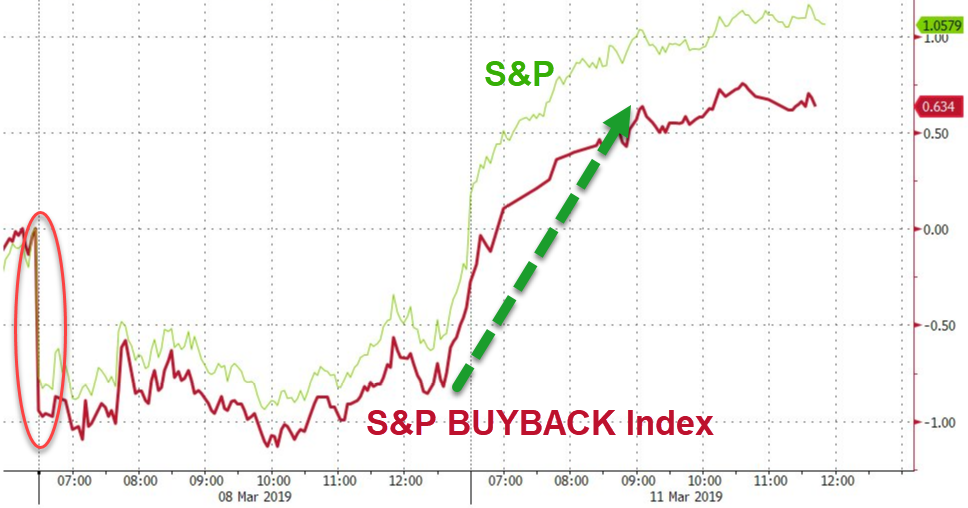
Also lending a helping hand to the bullish cause was a soaring S&P Buyback index and a short squeeze that catapulted the Russell 2000 out of the doldrums.
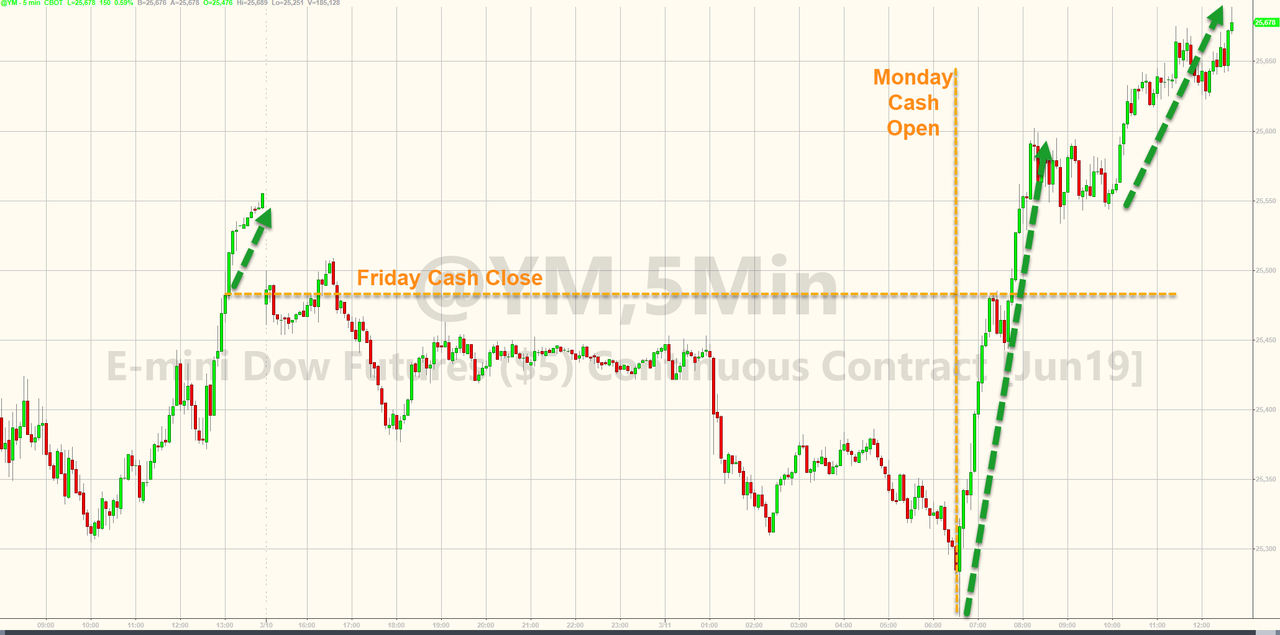
Our International Trend Tracking Index (TTI), which had slipped below its trend line the past 2 days, recovered and moved back into bull market territory for the time being. It was a good start to a new week, and we’ll have to wait and see if there is more follow through momentum to the upside, or if this was simply an outlier in a continuing correction.
- ETFs in the Spotlight
In case you missed the announcement and description of this section, you can read it here again.
It features 10 broadly diversified and sector ETFs from my HighVolume list as posted every Saturday. Furthermore, they are screened for the lowest MaxDD% number meaning they have been showing better resistance to temporary sell offs than all others over the past year.
The below table simply demonstrates the magnitude with which some of the ETFs are fluctuating regarding their positions above or below their respective individual trend lines (%M/A). A break below, represented by a negative number, shows weakness, while a break above, represented by a positive percentage, shows strength.
For hundreds of ETF choices, be sure to reference Thursday’s StatSheet.
Year to date, here’s how some our current candidates for this current ‘Buy’ cycle have fared:
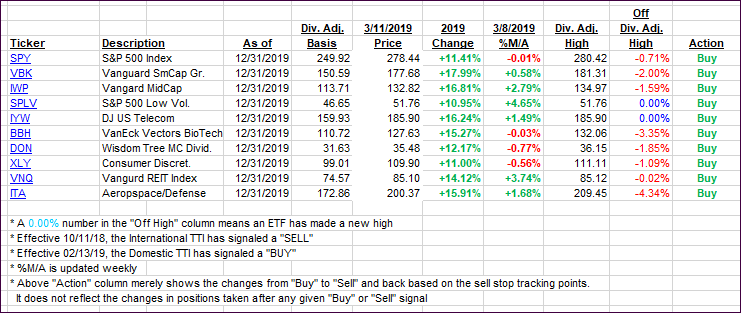
Again, the %M/A column above shows the position of the various ETFs in relation to their respective long-term trend lines, while the trailing sell stops are being tracked in the “Off High” column. The “Action” column will signal a “Sell” once the -8% point has been taken out in the “Off High” column. For more volatile sector ETFs, the trigger point is -10%.
- Trend Tracking Indexes (TTIs)
Our Trend Tracking Indexes (TTIs) recovered and headed north with the International one jumping back above its trend line into bullish territory.
Here’s how we closed 03/11/2019:
Domestic TTI: +2.10% above its M/A (last close +0.80%)—Buy signal effective 02/13/2019
International TTI: +0.41% above its M/A (last close -0.81%)—Buy signal effective 02/21/2019
Disclosure: I am obliged to inform you that I, as well as my advisory clients, own some of the ETFs listed in the above table. Furthermore, they do not represent a specific investment recommendation for you, they merely show which ETFs from the universe I track are falling within the specified guidelines.
Contact Ulli