
- Moving the markets
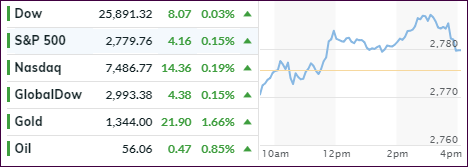
After briefly meandering below the unchanged line, the major indexes found some upward momentum and ended up closing modestly higher—although on very low volume.
A couple of assists helped to keep the bullish theme going.
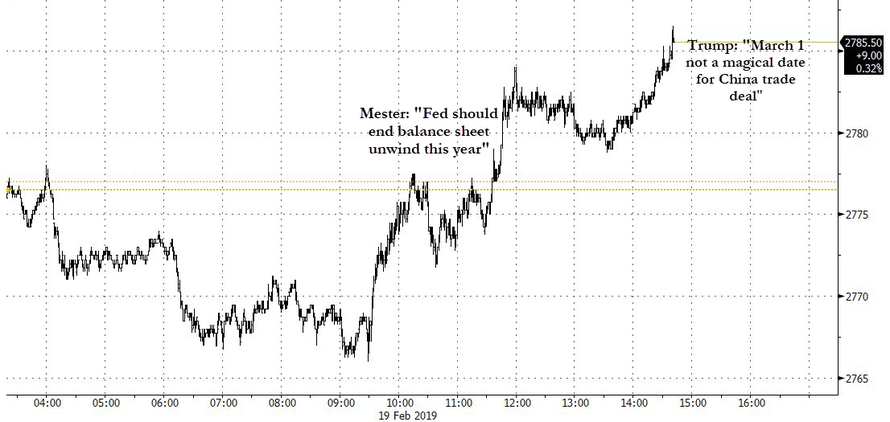
First, Cleveland Fed President Mester helped the markets higher by suggesting that the Fed should pause its balance sheet runoff, AKA Quantitative Tightening (QT), thereby keeping negative market effects to a minimum.
Second, the latest trade-related news came from Trump when he announced the March 1 “hard deadline” for raising tariffs on $200 billion of Chinese goods is not a “magical date” for reaching a deal with China.
He further insisted that the talks are going “well” even though there has been no evidence presented that the parties have even reached a memorandum of understanding. So, the jawboning continues with the computer algos ready to act on nothing but headline news in the hope to push the S&P 500 through the 2,800 level.
While our Domestic Trend Tracking Index (TTI) remains solidly on the bullish side of its long-term trend-line, the International one inched higher and stayed above its respective line now for the second day, although by only a small margin.
We need to see a little more staying power, before I will pull the trigger and announce a new ‘Buy’ for this arena as well.
- ETFs in the Spotlight
In case you missed the announcement and description of this section, you can read it here again.
It features 10 broadly diversified and sector ETFs from my HighVolume list as posted every Saturday. Furthermore, they are screened for the lowest MaxDD% number meaning they have been showing better resistance to temporary sell offs than all others over the past year.
The below table simply demonstrates the magnitude with which some of the ETFs are fluctuating regarding their positions above or below their respective individual trend lines (%M/A). A break below, represented by a negative number, shows weakness, while a break above, represented by a positive percentage, shows strength.
For hundreds of ETF choices, be sure to reference Thursday’s StatSheet.
Year to date, here’s how some our current candidates for this current ‘Buy’ cycle have fared:
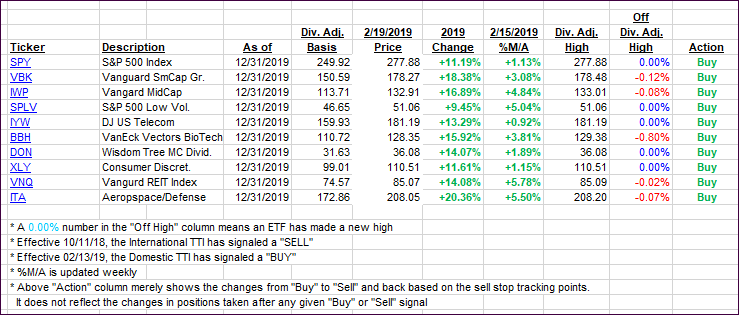
Again, the %M/A column above shows the position of the various ETFs in relation to their respective long-term trend lines, while the trailing sell stops are being tracked in the “Off High” column. The “Action” column will signal a “Sell” once the -8% point has been taken out in the “Off High” column. For more volatile sector ETFs, the trigger point is -10%.
- Trend Tracking Indexes (TTIs)
Our Trend Tracking Indexes (TTIs) inched higher with the International one slightly solidifying its position above the line. Again, as mentioned above, a little more staying power is needed to confirm a new ‘Buy’ signal.
Here’s how we closed 02/19/2019:
Domestic TTI: +3.07% above its M/A (last close +2.88%)—Buy signal effective 02/13/2019
International TTI: +0.82% above its M/A (last close +0.28%)—Sell signal effective 10/11/2018
Disclosure: I am obliged to inform you that I, as well as my advisory clients, own some of the ETFs listed in the above table. Furthermore, they do not represent a specific investment recommendation for you, they merely show which ETFs from the universe I track are falling within the specified guidelines.
Contact Ulli