
- Moving the markets
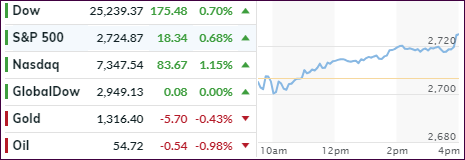
Despite a slow start, the major indexes picked up some steam and closed higher with technology leading the charge as the Nasdaq added +1.15%. Assisting the advance was a positive view of Alphabet’s (Google) upcoming quarterly report card and another round of earnings by some 97 members of the S&P 500.
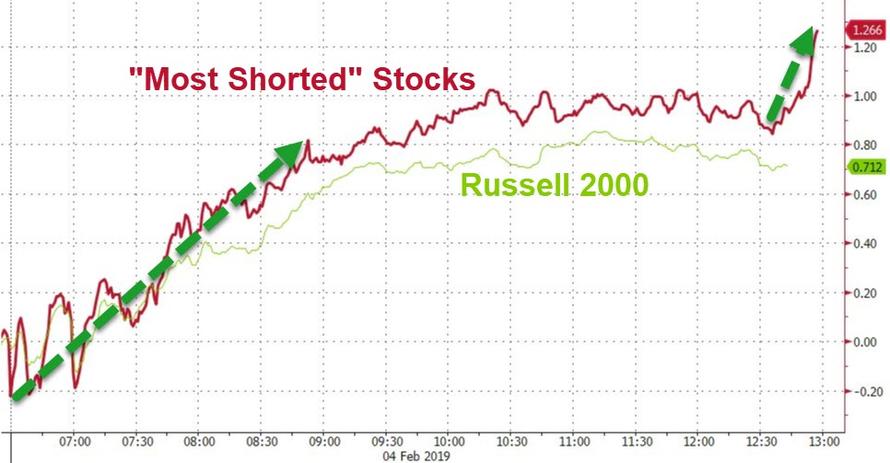
The markets in general continued to benefit from the Fed’s latest dovish signal that interest rate hikes were on hold until further notice. As I posted before, this fact more than any other will contribute to further upward momentum in support of equities. Of course, the continued short-squeeze helped the bullish cause as well.
On deck I see possible additional market support in form of the China trades talks, which so far have been a headwind to equity markets. That could change in a hurry if some verifiable positive headlines about the March 1 deadline (increase in tariffs) show that a solution has been found and accepted by the warring parties.
With today’s action, our leading indicator, the Domestic Trend Tracking Index (TTI), has crawled above its trend line (see section 3) into bullish territory for the first time since 11/15/18. It’s now hovering at +0.36% above the line, and I need to see a little staying power before a new ‘Buy’ signal will be triggered.
- ETFs in the Spotlight
In case you missed the announcement and description of this section, you can read it here again.
It features 10 broadly diversified and sector ETFs from my HighVolume list as posted every Saturday. Furthermore, they are screened for the lowest MaxDD% number meaning they have been showing better resistance to temporary sell offs than all others over the past year.
The below table simply demonstrates the magnitude with which some of the ETFs are fluctuating regarding their positions above or below their respective individual trend lines (%M/A). A break below, represented by a negative number, shows weakness, while a break above, represented by a positive percentage, shows strength.
For hundreds of ETF choices, be sure to reference Thursday’s StatSheet.
Year to date, here’s how our original candidates from the last cycle have fared:
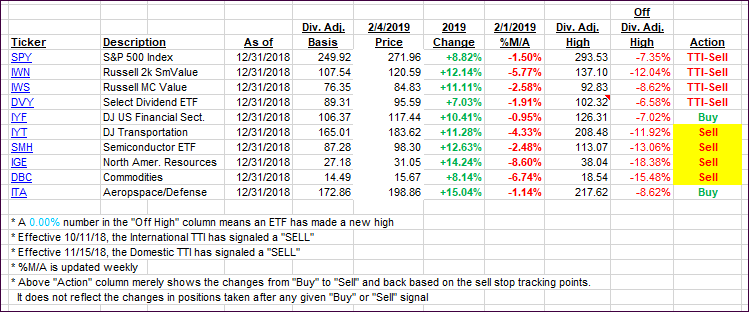
Again, the %M/A column above shows the position of the various ETFs in relation to their respective long-term trend lines, while the trailing sell stops are being tracked in the “Off High” column. The “Action” column will signal a “Sell” once the -8% point has been taken out in the “Off High” column. For more volatile sector ETFs, the trigger point is -10%.
- Trend Tracking Indexes (TTIs)
Our Trend Tracking Indexes (TTIs) improved with the Domestic one crossing to the bullish side of its trend line.
Here’s how we closed 02/04/2019:
Domestic TTI: +0.36% below its M/A (last close -0.19%)—Sell signal effective 11/15/2018
International TTI: -0.93% below its M/A (last close -0.97%)—Sell signal effective 10/11/2018
Disclosure: I am obliged to inform you that I, as well as my advisory clients, own some of the ETFs listed in the above table. Furthermore, they do not represent a specific investment recommendation for you, they merely show which ETFs from the universe I track are falling.
Contact Ulli