
- Moving the markets
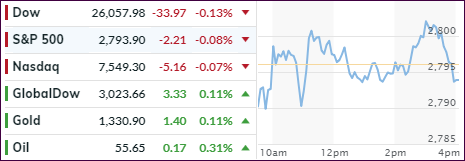
The markets were on standby this morning hanging on every word that Fed chair Powell was uttering at a congressional testimony. He confirmed that the central bank has adopted a wait-and-see approach due to some economic data having pointed to slower U.S. growth, despite a report showing an increase in consumer confidence.
He added that “the job market remains strong” and “we are seeing signs of stronger wage growth,” a remark that may have some members of his interest rate committee consider voting for a hike in rates in order to front-run any resulting inflation.
With no new earth-shaking news coming our way from the U.S.-China trade talks, the markets focused on the above, with bulls and bears slugging it out around the unchanged line with no clear winner at the end.
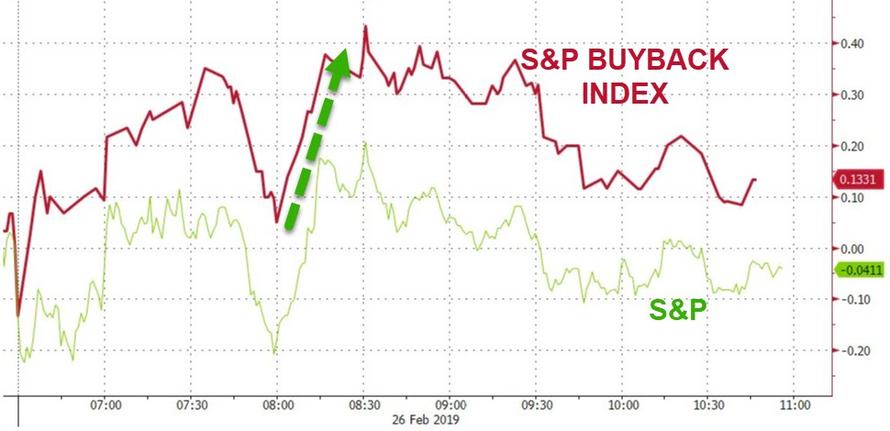
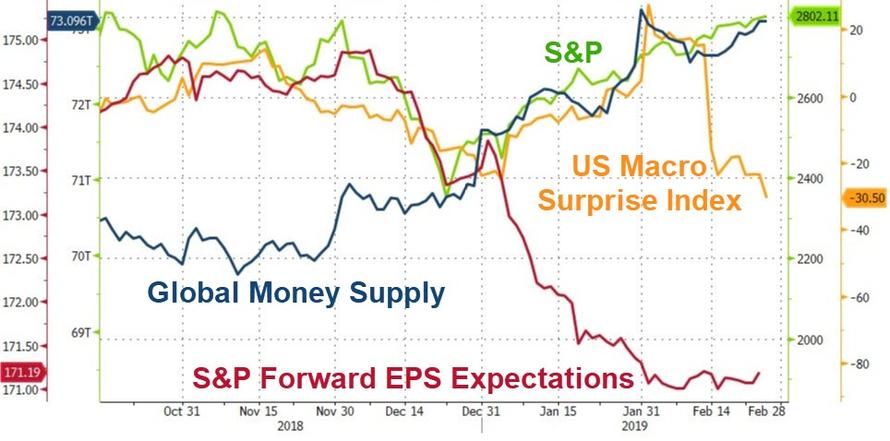
The S&P 500 ran into tough overhead resistance at the 2,800 level again and seemed to take directional cues from the S&P Buyback index. Looking at big picture, we see an interesting trend. Namely, that the S&P 500 follows Global Money Supply, while being out of sync with the US Macro Surprise Index and forward EPS expectations.
Eventually, something will have to give to bring these indicators back into alignment. Will the S&P 500 move down or will the other 2 indicators move up?
- ETFs in the Spotlight
In case you missed the announcement and description of this section, you can read it here again.
It features 10 broadly diversified and sector ETFs from my HighVolume list as posted every Saturday. Furthermore, they are screened for the lowest MaxDD% number meaning they have been showing better resistance to temporary sell offs than all others over the past year.
The below table simply demonstrates the magnitude with which some of the ETFs are fluctuating regarding their positions above or below their respective individual trend lines (%M/A). A break below, represented by a negative number, shows weakness, while a break above, represented by a positive percentage, shows strength.
For hundreds of ETF choices, be sure to reference Thursday’s StatSheet.
Year to date, here’s how some our current candidates for this current ‘Buy’ cycle have fared:
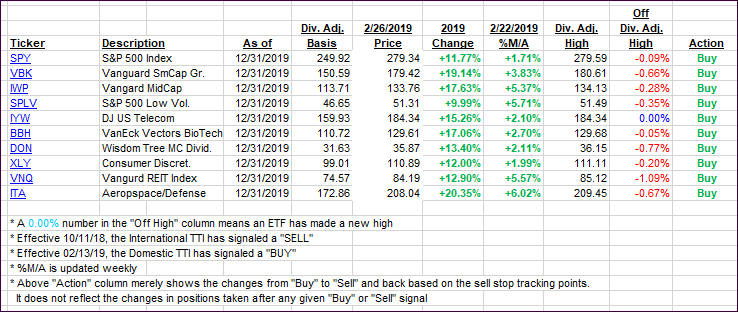
Again, the %M/A column above shows the position of the various ETFs in relation to their respective long-term trend lines, while the trailing sell stops are being tracked in the “Off High” column. The “Action” column will signal a “Sell” once the -8% point has been taken out in the “Off High” column. For more volatile sector ETFs, the trigger point is -10%.
- Trend Tracking Indexes (TTIs)
Our Trend Tracking Indexes (TTIs) were mixed with the International one gaining and the Domestic one slightly dropping.
Here’s how we closed 02/26/2019:
Domestic TTI: +3.22% above its M/A (last close +3.49%)—Buy signal effective 02/13/2019
International TTI: +1.86% above its M/A (last close +1.77%)—Buy signal effective 02/21/2019
Disclosure: I am obliged to inform you that I, as well as my advisory clients, own some of the ETFs listed in the above table. Furthermore, they do not represent a specific investment recommendation for you, they merely show which ETFs from the universe I track are falling within the specified guidelines.
Contact Ulli