
- Moving the markets
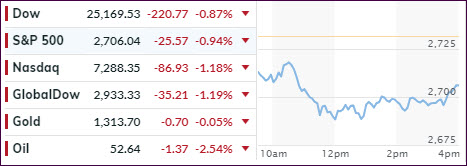
Right after the opening bell, the major indexes took a dive as a cocktail of global risks kept traders occupied. The usual suspects, namely U.S.-China trade tensions, the U.K Brexit and a sharp slowdown in Chinese growth, combined to put the bulls on notice that all may not be well with this world and south we went.
Considering the strength of the recent bear market rally, the pullback was not significant, however, it could indicate that bearish forces could come into play again. Poor earnings and weak data out of Germany put their markets on a southerly course, as algos and traders desperately looked in vain for positive headlines. Concerns spread that the slowing growth in China has already affected the European Union.
In the end, the pullback was enough to change the position of our Domestic Trend Tacking Index (TTI), which had crawled above its long-term trend 4 days ago. Today’s market drop was sharp enough to push our index back below the line into bear market territory by a tiny margin (section 3). So, we’re on hold and will not take any action until a clear break to the upside has occurred again and is accompanied by some staying power.
- ETFs in the Spotlight
In case you missed the announcement and description of this section, you can read it here again.
It features 10 broadly diversified and sector ETFs from my HighVolume list as posted every Saturday. Furthermore, they are screened for the lowest MaxDD% number meaning they have been showing better resistance to temporary sell offs than all others over the past year.
The below table simply demonstrates the magnitude with which some of the ETFs are fluctuating regarding their positions above or below their respective individual trend lines (%M/A). A break below, represented by a negative number, shows weakness, while a break above, represented by a positive percentage, shows strength.
For hundreds of ETF choices, be sure to reference Thursday’s StatSheet.
Year to date, here’s how our original candidates from the last cycle have fared:
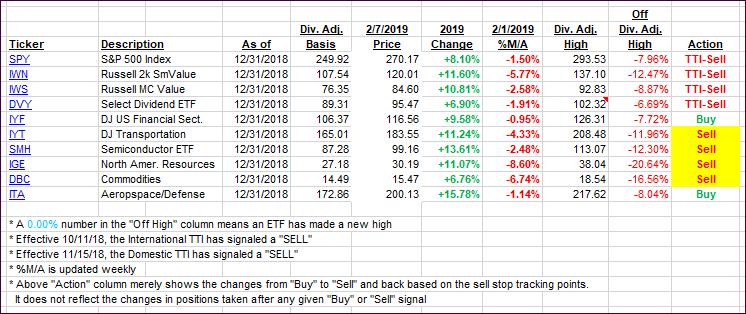
Again, the %M/A column above shows the position of the various ETFs in relation to their respective long-term trend lines, while the trailing sell stops are being tracked in the “Off High” column. The “Action” column will signal a “Sell” once the -8% point has been taken out in the “Off High” column. For more volatile sector ETFs, the trigger point is -10%.
- Trend Tracking Indexes (TTIs)
Our Trend Tracking Indexes (TTIs) headed south with the Domestic one dipping back into bear market territory by the tiniest of margins.
Here’s how we closed 02/07/2019:
Domestic TTI: -0.06% below its M/A (last close +0.65%)—Sell signal effective 11/15/2018
International TTI: -1.47% below its M/A (last close -0.34%)—Sell signal effective 10/11/2018
Disclosure: I am obliged to inform you that I, as well as my advisory clients, own some of the ETFs listed in the above table. Furthermore, they do not represent a specific investment recommendation for you, they merely show which ETFs from the universe I track are falling.
Contact Ulli