

- Moving the markets
The much-anticipated Fed minutes (from their January meeting) showed that officials were divided on future interest rate hikes. One side argued that an increase might only be needed if inflation would exceed their baseline forecast. The other side thought it would be appropriate to hike later this year, if the economy behaves as expected.
Fed officials admitted that their U-turn on policy in December, which pulled the markets out of the doldrums, was necessary due to a more uncertain economic outlook and a tightening of financial conditions.
There was nothing earthshaking in these revelations, so the major indexes see-sawed around their respective unchanged lines but were able to maintain their upward bias by closing fractionally in the green.
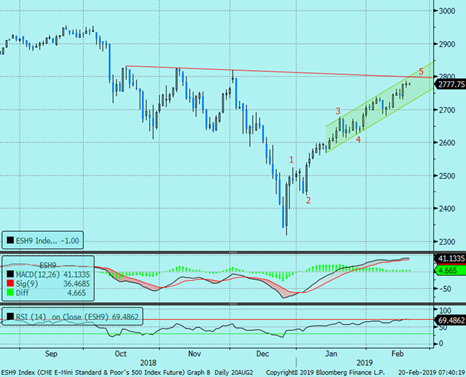
Technically speaking, the S&P 500 faces major overhead resistance at the 2,800 level, which has also been called a quadruple top. It may take some serious effort and several attempts, supported by “awesome” headline news, to break through this glass ceiling.
Our Trend Tracking Indexes (TTIs) remain in bullish territory with the International one now having established itself firmly above its trend line thereby generating a new ‘Buy’ for “broadly diversified international ETFs.” Please see section 3 below for details.
- ETFs in the Spotlight
In case you missed the announcement and description of this section, you can read it here again.
It features 10 broadly diversified and sector ETFs from my HighVolume list as posted every Saturday. Furthermore, they are screened for the lowest MaxDD% number meaning they have been showing better resistance to temporary sell offs than all others over the past year.
The below table simply demonstrates the magnitude with which some of the ETFs are fluctuating regarding their positions above or below their respective individual trend lines (%M/A). A break below, represented by a negative number, shows weakness, while a break above, represented by a positive percentage, shows strength.
For hundreds of ETF choices, be sure to reference Thursday’s StatSheet.
Year to date, here’s how some our current candidates for this current ‘Buy’ cycle have fared:
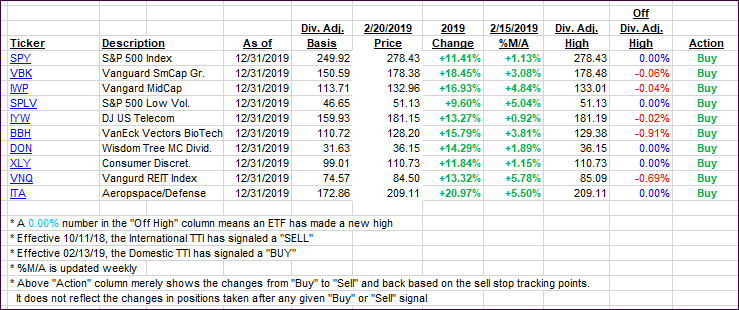
Again, the %M/A column above shows the position of the various ETFs in relation to their respective long-term trend lines, while the trailing sell stops are being tracked in the “Off High” column. The “Action” column will signal a “Sell” once the -8% point has been taken out in the “Off High” column. For more volatile sector ETFs, the trigger point is -10%.
- Trend Tracking Indexes (TTIs)
Our Trend Tracking Indexes (TTIs) edged higher with the international one now having reached a level above its trend line that confirms a new ‘Buy’ for that arena.
In my advisor practice, I will first watch market behavior tomorrow to see if there is a severe sell-off in the making. If there isn’t, I will allocate clients’ assets in the international arena as well, but I will select only low volatility ETFs due to the ever-present danger of a pullback from these highly elevated levels.
Here’s how we closed 02/20/2019:
Domestic TTI: +3.44% above its M/A (last close +3.07%)—Buy signal effective 02/13/2019
International TTI: +1.26% above its M/A (last close +0.82%)—Buy signal effective 02/21/2019
Disclosure: I am obliged to inform you that I, as well as my advisory clients, own some of the ETFs listed in the above table. Furthermore, they do not represent a specific investment recommendation for you, they merely show which ETFs from the universe I track are falling within the specified guidelines.
Contact Ulli