
- Moving the markets
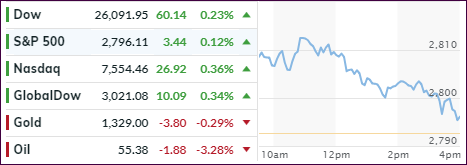
An early bounce had the S&P 500 piercing its overhead resistance zone, namely the 2,800 point. However, the index was not able to hold on, as a slow and steady decline pulled equities off their lofty levels. Good thing we ran out of time, or we might have seen a red close.
As it turned out, the major indexes ended up only fractionally in the green, as early euphoria, that Trump may be inclined to delay China tariffs, waned. But he said that “substantial progress” in trade talks have been made over the weekend.
So, the trade deal headlines appear to be a wonderful tool to keep the markets in check now that the earnings season has ended. Any economic news, no matter how poor they are, register as “good news” for the computer algos, as we’ve seen last week when retail sales collapsed.
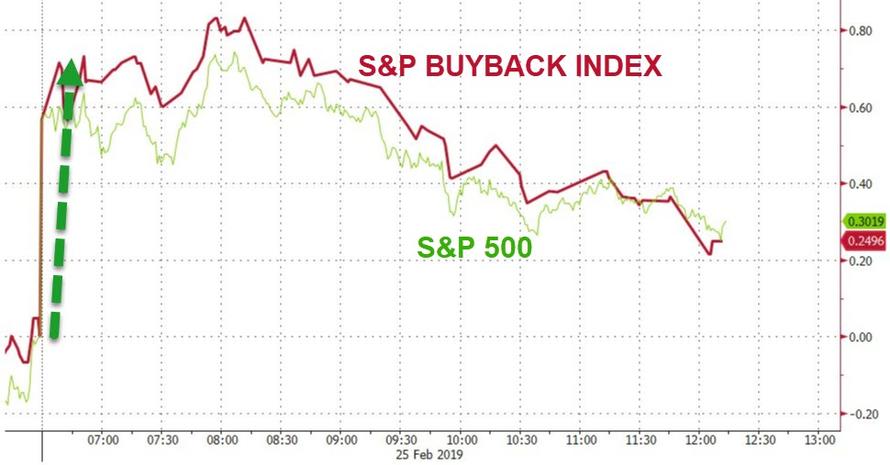
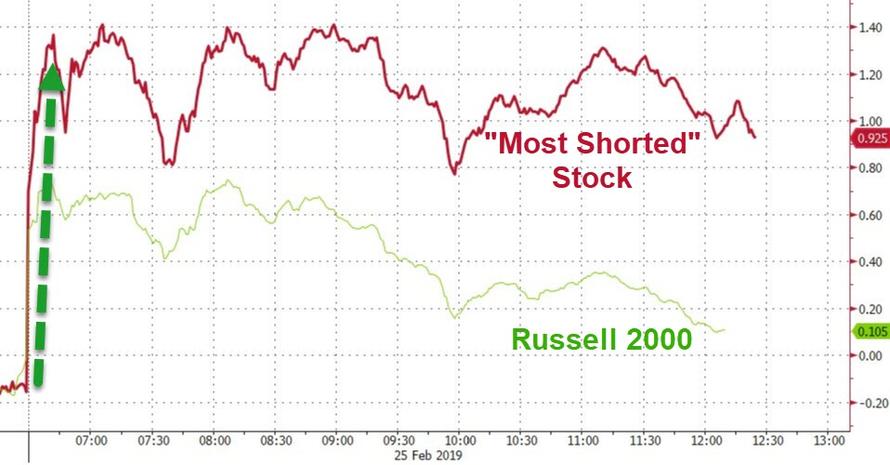
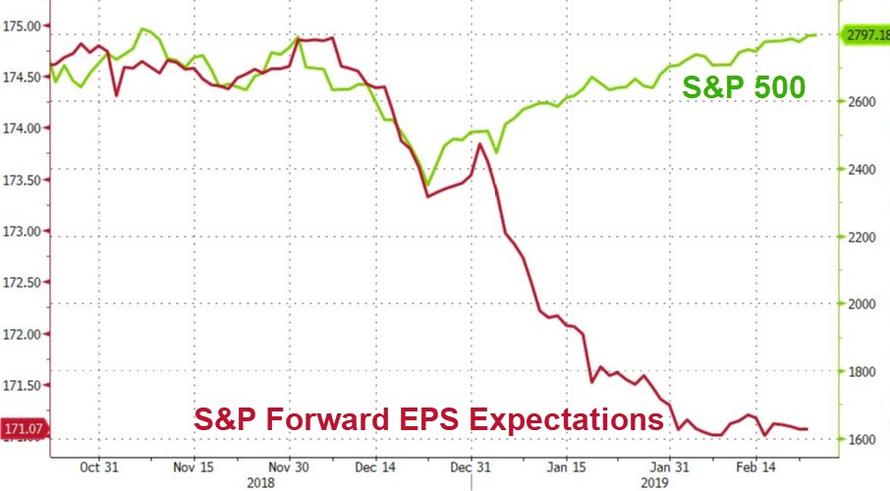
Additional assists supporting the early rally came from corporate buybacks and a huge short squeeze, both of which were the spark that got things going. And then there is this diversion, which, no matter how many times I post it, leaves me pondering: Who will be right in the end?
- ETFs in the Spotlight
In case you missed the announcement and description of this section, you can read it here again.
It features 10 broadly diversified and sector ETFs from my HighVolume list as posted every Saturday. Furthermore, they are screened for the lowest MaxDD% number meaning they have been showing better resistance to temporary sell offs than all others over the past year.
The below table simply demonstrates the magnitude with which some of the ETFs are fluctuating regarding their positions above or below their respective individual trend lines (%M/A). A break below, represented by a negative number, shows weakness, while a break above, represented by a positive percentage, shows strength.
For hundreds of ETF choices, be sure to reference Thursday’s StatSheet.
Year to date, here’s how some our current candidates for this current ‘Buy’ cycle have fared:
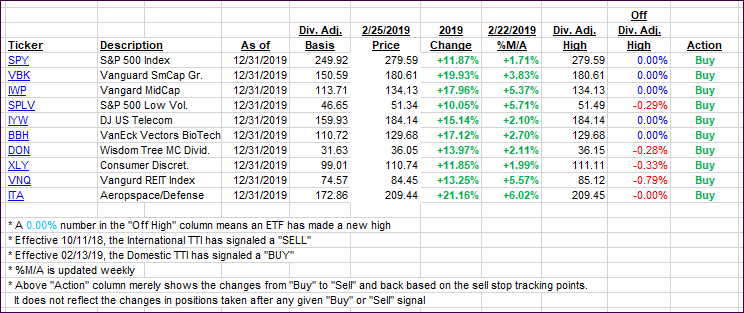
Again, the %M/A column above shows the position of the various ETFs in relation to their respective long-term trend lines, while the trailing sell stops are being tracked in the “Off High” column. The “Action” column will signal a “Sell” once the -8% point has been taken out in the “Off High” column. For more volatile sector ETFs, the trigger point is -10%.
- Trend Tracking Indexes (TTIs)
Our Trend Tracking Indexes (TTIs) inched up with the International one showing more strength during this session.
Here’s how we closed 02/25/2019:
Domestic TTI: +3.49% above its M/A (last close +3.47%)—Buy signal effective 02/13/2019
International TTI: +1.77% above its M/A (last close +1.44%)—Buy signal effective 02/21/2019
Disclosure: I am obliged to inform you that I, as well as my advisory clients, own some of the ETFs listed in the above table. Furthermore, they do not represent a specific investment recommendation for you, they merely show which ETFs from the universe I track are falling within the specified guidelines.
Contact Ulli