
- Moving the markets
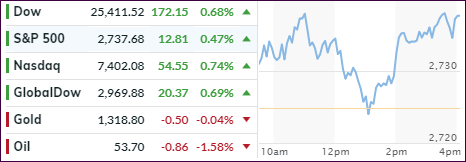
One look at the chart tells the story. An early rebound failed miserably with the S&P 500 dipping back into the red, then recovering and closing at the early high of the session. All eyes are now on the 200-day M/A, which today acted as overhead resistance.
At 2,742 we are only some 4 points away from conquering that level, which Wall Street considers to be the return to the bullish theme. Our Domestic TTI has already crossed into bullish territory and, should momentum not change much over the next couple of days, will generate a new ‘Buy’ signal.
If the S&P 500 manages to crawl back above its line, it will have been the fastest V-shape recovery on record considering that only at Christmas the index was hovering in bear market territory, mostly defined as a drop of 20% or more off recent highs.
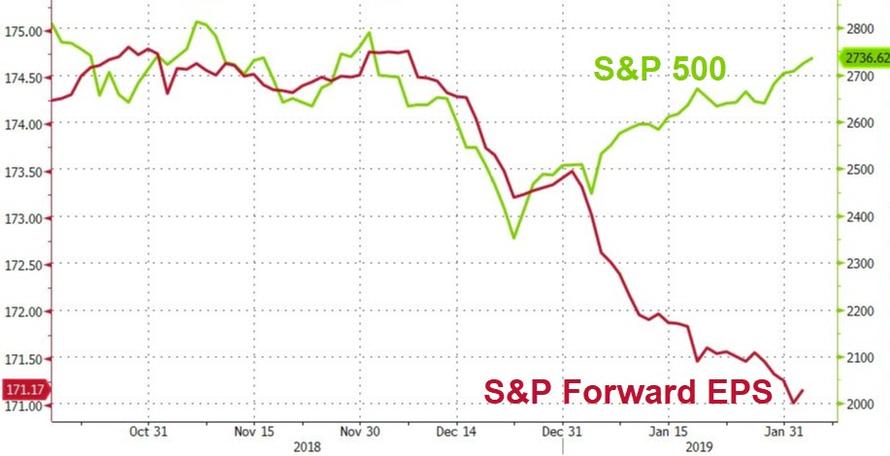
While this has been the best start to a year for the S&P 500 since 1987, as ZH points out, it has been the worst start for earnings expectations in 3 years. However, be that as it may, I am preparing to re-enter the markets and will post the exact entry date.
- ETFs in the Spotlight
In case you missed the announcement and description of this section, you can read it here again.
It features 10 broadly diversified and sector ETFs from my HighVolume list as posted every Saturday. Furthermore, they are screened for the lowest MaxDD% number meaning they have been showing better resistance to temporary sell offs than all others over the past year.
The below table simply demonstrates the magnitude with which some of the ETFs are fluctuating regarding their positions above or below their respective individual trend lines (%M/A). A break below, represented by a negative number, shows weakness, while a break above, represented by a positive percentage, shows strength.
For hundreds of ETF choices, be sure to reference Thursday’s StatSheet.
Year to date, here’s how our original candidates from the last cycle have fared:
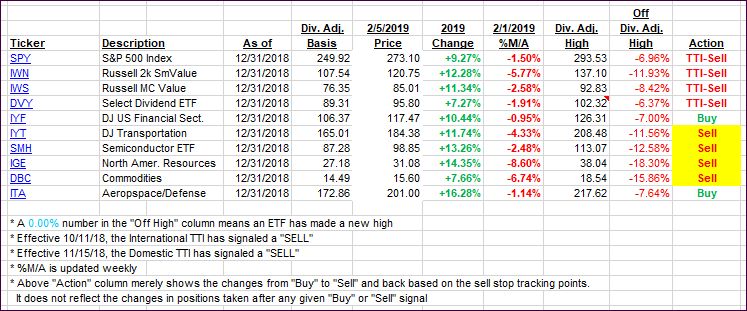
Again, the %M/A column above shows the position of the various ETFs in relation to their respective long-term trend lines, while the trailing sell stops are being tracked in the “Off High” column. The “Action” column will signal a “Sell” once the -8% point has been taken out in the “Off High” column. For more volatile sector ETFs, the trigger point is -10%.
- Trend Tracking Indexes (TTIs)
Our Trend Tracking Indexes (TTIs) improved again with the Domestic one remaining above the line for the second day, while the International one has moved to within striking distance of a northerly break.
Here’s how we closed 02/05/2019:
Domestic TTI: +0.74% below its M/A (last close +0.36%)—Sell signal effective 11/15/2018
International TTI: -0.25% below its M/A (last close -0.93%)—Sell signal effective 10/11/2018
Disclosure: I am obliged to inform you that I, as well as my advisory clients, own some of the ETFs listed in the above table. Furthermore, they do not represent a specific investment recommendation for you, they merely show which ETFs from the universe I track are falling.
Contact Ulli