
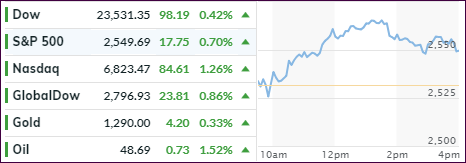
- Moving the markets
At least for today, we’re back to the theme of last year when, on many occasions, bad news was good news and kept the bullish dream alive. I was reminded of that this morning when, after last week’s terrible manufacturing index (ISM) numbers, it was the US Service Economy’s turn to plummet (December data), as the index slipped from 60.7 to 57.6 vs. expectations of 59, and matching July lows.
Of course, in the whacked-out world of computer algos, this was good news, as it adds a glimmer of hope that the Fed will remain dovish and stay away from further interest rate hikes.
Helping the bulls to score another session in the green were reports that US-China talks resumed as ‘senior’ officials from China unexpectedly showed up for negotiations in Washington. That sparked some optimism in the markets, which will last exactly until news headlines refute that any progress has been made. But, maybe it’s different this time…
The major indexes closed modestly higher, after pulling back mid-day when Trump announced his address of the nation tomorrow. In the meantime, the spanking of the US Dollar continued to accelerate after Fed’s Powell U-turn from hawkishness towards dovishness.
In my advisor practice, we are and have been in cash on the sidelines since 11/15/18 with our Domestic TTI (see section 3) still lingering on the bearish side of its long-term trend line.
- ETFs in the Spotlight
In case you missed the announcement and description of this section, you can read it here again.
It features 10 broadly diversified and sector ETFs from my HighVolume list as posted every Saturday. Furthermore, they are screened for the lowest MaxDD% number meaning they have been showing better resistance to temporary sell offs than all others over the past year.
The below table simply demonstrates the magnitude with which some of the ETFs are fluctuating regarding their positions above or below their respective individual trend lines (%M/A). A break below, represented by a negative number, shows weakness, while a break above, represented by a positive percentage, shows strength.
For hundreds of ETF choices, be sure to reference Thursday’s StatSheet.
Year to date, here’s how our original candidates from the last cycle have fared:
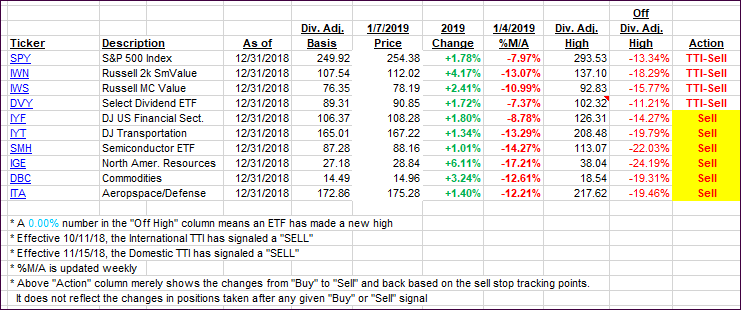
Again, the %M/A column above shows the position of the various ETFs in relation to their respective long-term trend lines, while the trailing sell stops are being tracked in the “Off High” column. The “Action” column will signal a “Sell” once the -8% point has been taken out in the “Off High” column. For more volatile sector ETFs, the trigger point is -10%.
- Trend Tracking Indexes (TTIs)
Our Trend Tracking Indexes (TTIs) improved, as the major indexes scored another session in the green.
Here’s how we closed 01/07/2019:
Domestic TTI: -7.13% below its M/A (last close -8.09%)—Sell signal effective 11/15/2018
International TTI: -6.56% below its M/A (last close -7.38%)—Sell signal effective 10/11/2018
Disclosure: I am obliged to inform you that I, as well as my advisory clients, own some of the ETFs listed in the above table. Furthermore, they do not represent a specific investment recommendation for you, they merely show which ETFs from the universe I track are falling.
Contact Ulli