
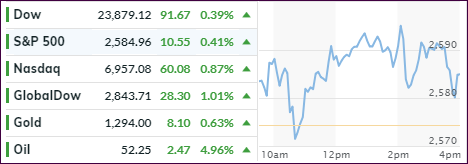
- Moving the markets
The much-discussed mid-level US-China trade talks came to an end today with the warring factions jawboning about “being serious” coming to an agreement and that “progress has been made.” Both parties announced to release a “message” on Thursday.
The market impact was minor but kept the major indexes in positive territory early on. All eyes were on the release of the Fed minutes where members of the FOMC showed some willingness to delay further rate hikes due to the volatility in financial markets while, at the same time, concern about global growth, or lack thereof, was foremost on their minds.
In the end, it seemed that future monetary policy would be more “cautious,” which goes along with Powell’s recent U-turn that the Fed would change policy swiftly if economic conditions warrant such a move. While these words seemed to calm the markets, the see-sawing continued but kept the major indexes in the green.
ZH added that during the last four days we have witnessed the biggest short-squeeze since March 2009, while China pumped and dumped and Europe extended its gains led by Italy. The US Dollar tumbled the most since last November to its lowest since September 2018.
Equities are now up 8 of the last 10 days, which translates into the best start to a year since 2010. As I keep mentioning, the most impressive rebounds and jaw-dropping dips happen while we are in a bear market.
The question remains, will there be enough staying power to lift our Domestic TTI back into bullish territory? Very possible. If the Fed continues to play ball the way the markets like it, and Trump gets an acceptable trade deal with China, we may very well see a new domestic Buy signal develop soon.
- ETFs in the Spotlight
In case you missed the announcement and description of this section, you can read it here again.
It features 10 broadly diversified and sector ETFs from my HighVolume list as posted every Saturday. Furthermore, they are screened for the lowest MaxDD% number meaning they have been showing better resistance to temporary sell offs than all others over the past year.
The below table simply demonstrates the magnitude with which some of the ETFs are fluctuating regarding their positions above or below their respective individual trend lines (%M/A). A break below, represented by a negative number, shows weakness, while a break above, represented by a positive percentage, shows strength.
For hundreds of ETF choices, be sure to reference Thursday’s StatSheet.
Year to date, here’s how our original candidates from the last cycle have fared:
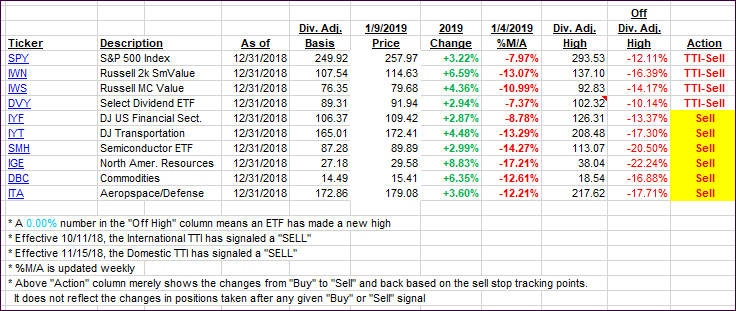
Again, the %M/A column above shows the position of the various ETFs in relation to their respective long-term trend lines, while the trailing sell stops are being tracked in the “Off High” column. The “Action” column will signal a “Sell” once the -8% point has been taken out in the “Off High” column. For more volatile sector ETFs, the trigger point is -10%.
- Trend Tracking Indexes (TTIs)
Our Trend Tracking Indexes (TTIs) followed the positive momentum and moved closer to their respective trend lines.
Here’s how we closed 01/09/2019:
Domestic TTI: -5.47% below its M/A (last close -6.13%)—Sell signal effective 11/15/2018
International TTI: -5.00% below its M/A (last close -5.96%)—Sell signal effective 10/11/2018
Disclosure: I am obliged to inform you that I, as well as my advisory clients, own some of the ETFs listed in the above table. Furthermore, they do not represent a specific investment recommendation for you, they merely show which ETFs from the universe I track are falling.
Contact Ulli