
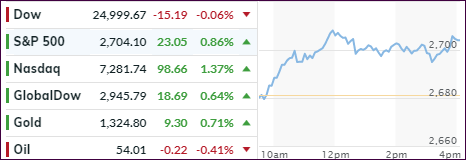
- Moving the markets
You could almost feel the giddiness of the Wall Street traders after Fed head Powell’s signal yesterday that interest rate hikes are on pause. He then surprised the markets with a separate statement indicating that a further unwind of its $4 trillion asset portfolio could end sooner than expected adding that market turbulence was a key consideration for this change.
In other words, the current unwinding, which is akin to QT (Quantitative Tightening), is now in the rear-view mirror, and any further softness in the markets may possibly be greeted with QE (Quantitative Easing), meaning that the Fed could step in to support asset prices. We now have a return to the Bernanke put, which is designed to rescue falling markets via a lowering of interest rates.
This is a “huuge” change and will likely mean that a new bull market is on deck, which may be confirmed by our Trend Tracking Indexes (TTIs) as early as next week. While we have seen a V-shape type of recovery since Christmas, that does not mean profits have been made. Far from it. With the losses of the last quarter, during which the S&P 500 dropped -14%, Buy-and-Hold investors have not broken even yet, but they made up a lot, as the S&P 500 recovered +7.9% in January.
Case in point: Since the effective date of our domestic ‘Sell’ signal on 11/15/18, the S&P 500 (SPY) is still down -1.18%. It means that as trend followers we did not participate in the drop and consequently were not involved in the rebound.
We now have seen as opposite of two markets as you can imagine. After the worst December in 100 years, the S&P 500 just experienced its best January in 32 years. Nothing fundamentally has changed regarding economic conditions, but the Fed has altered policy direction from hawkish to dovish.
Silly me, and I thought markets were freely traded…
- ETFs in the Spotlight
In case you missed the announcement and description of this section, you can read it here again.
It features 10 broadly diversified and sector ETFs from my HighVolume list as posted every Saturday. Furthermore, they are screened for the lowest MaxDD% number meaning they have been showing better resistance to temporary sell offs than all others over the past year.
The below table simply demonstrates the magnitude with which some of the ETFs are fluctuating regarding their positions above or below their respective individual trend lines (%M/A). A break below, represented by a negative number, shows weakness, while a break above, represented by a positive percentage, shows strength.
For hundreds of ETF choices, be sure to reference Thursday’s StatSheet.
Year to date, here’s how our original candidates from the last cycle have fared:
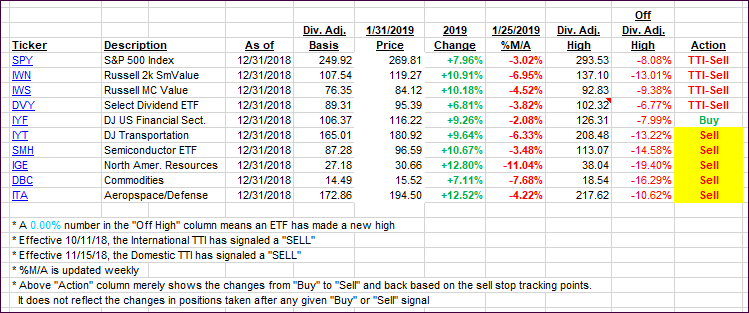
Again, the %M/A column above shows the position of the various ETFs in relation to their respective long-term trend lines, while the trailing sell stops are being tracked in the “Off High” column. The “Action” column will signal a “Sell” once the -8% point has been taken out in the “Off High” column. For more volatile sector ETFs, the trigger point is -10%.
- Trend Tracking Indexes (TTIs)
Our Trend Tracking Indexes (TTIs) improved markedly with especially the Domestic one moving within striking distance of crossing into bull market territory.
Here’s how we closed 01/31/2019:
Domestic TTI: -0.38% below its M/A (last close -1.06%)—Sell signal effective 11/15/2018
International TTI: -1.13% below its M/A (last close -1.53%)—Sell signal effective 10/11/2018
Disclosure: I am obliged to inform you that I, as well as my advisory clients, own some of the ETFs listed in the above table. Furthermore, they do not represent a specific investment recommendation for you, they merely show which ETFs from the universe I track are falling.
Contact Ulli