
- Moving the markets
Apple Computers started today’s market fallout yesterday afternoon by announcing weaker than expected iPhone sales and shockingly reduced its revenue guidance. Part of the blame was put on China due to the “magnitude of their economic deceleration.” The punishment was instantaneous with Apple’s stock dropping some 8% in the after-hours session.
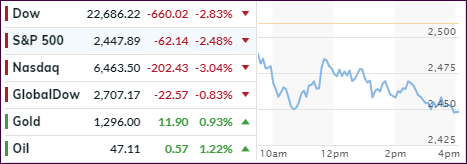
With that backdrop, it did not take a genius to figure out that today would be disastrous for equities, and that’s exactly what happened. Right after the opening bell, the Dow plunged some 650 points, before a modest climb reduced traders’ anxiety somewhat but, at the end of the session, we set new lows for the day.
In addition to bearish Apple news, manufacturing numbers (ISM) were terrible and showed a decline to 54.1 in December from 59.3 vs. an expected 57.9. This was the biggest monthly drop since the financial crises, when in October 2008 it slipped by 9 points.
Everything plunged including bond yields with the 10-year sinking to 2.57%, its lowest level in a year. And as ZH noted, the 1-year bond yield is now only 2 basis points away from surpassing the yield on the 10-year making US recession fears even more realistic.
The US dollar fell as well, while only gold and oil showed some green numbers. The bear market is alive and well and has spread the suffering to well-known hedge fund managers, Warren Buffet’s Berkshire fund and the Swiss National Bank, which are all massive holders of Apple stock. Billions of dollars have been lost, as Apple has dropped some 31% in the past 3 months. Ouch!
It’s good to be on the sidelines, because the way things look there may be much more pain to come.
- ETFs in the Spotlight
In case you missed the announcement and description of this section, you can read it here again.
It features 10 broadly diversified and sector ETFs from my HighVolume list as posted every Saturday. Furthermore, they are screened for the lowest MaxDD% number meaning they have been showing better resistance to temporary sell offs than all others over the past year.
The below table simply demonstrates the magnitude with which some of the ETFs are fluctuating regarding their positions above or below their respective individual trend lines (%M/A). A break below, represented by a negative number, shows weakness, while a break above, represented by a positive percentage, shows strength.
For hundreds of ETF choices, be sure to reference Thursday’s StatSheet.
Year to date, here’s how our original candidates from the last cycle have fared:
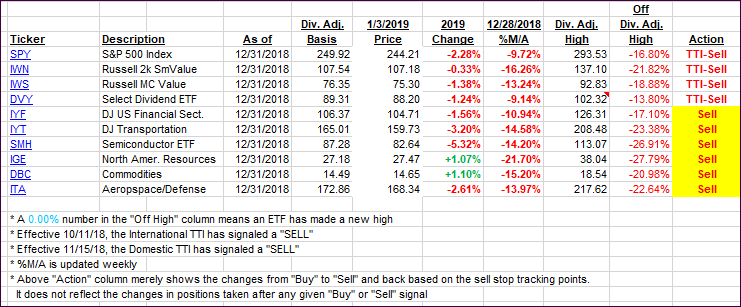
Again, the %M/A column above shows the position of the various ETFs in relation to their respective long-term trend lines, while the trailing sell stops are being tracked in the “Off High” column. The “Action” column will signal a “Sell” once the -8% point has been taken out in the “Off High” column. For more volatile sector ETFs, the trigger point is -10%.
- Trend Tracking Indexes (TTIs)
Our Trend Tracking Indexes (TTIs) dove deeper into bear market territory.
Here’s how we closed 01/03/2019:
Domestic TTI: -11.15% below its M/A (last close -9.39%)—Sell signal effective 11/15/2018
International TTI: -9.73% below its M/A (last close -8.98%)—Sell signal effective 10/11/2018
Disclosure: I am obliged to inform you that I, as well as my advisory clients, own some of the ETFs listed in the above table. Furthermore, they do not represent a specific investment recommendation for you, they merely show which ETFs from the universe I track are falling.
Contact Ulli