- Moving the markets
Netflix was the major driver to get things started in the bullish direction and kept things alive throughout the session, despite earnings growth estimates having fallen recently to less than half the average growth for the first three quarters.
However, that did not matter, what was most important was that Netflix’s price hike prompted buying throughout the session with the Nasdaq benefiting the most. The fly in the ointment was Senator Grassley’s remark that there was “little progress” in the China talks as well as the “failed” Brexit amendment vote.
Even JP Morgan’s earnings disappointment did nothing to stop the computer algos from ramping things higher. In graphic form, you can see the effect on the markets here. So far, early announcements about future guidance was ignored, as first Apple, then Delta, Barnes & Noble, Macy’s, American Airlines, Alibaba and now Goodyear Tire have all slashed their outlook.
As more guidance cuts, like the above ones, make companies tell the truth about economic reality, Morgan Stanley may be right with their proclamation that we will soon see an earnings recession rather than an earnings season.
Hmm, makes me wonder if the computer algos are programmed to deal with that scenario.
- ETFs in the Spotlight
In case you missed the announcement and description of this section, you can read it here again.
It features 10 broadly diversified and sector ETFs from my HighVolume list as posted every Saturday. Furthermore, they are screened for the lowest MaxDD% number meaning they have been showing better resistance to temporary sell offs than all others over the past year.
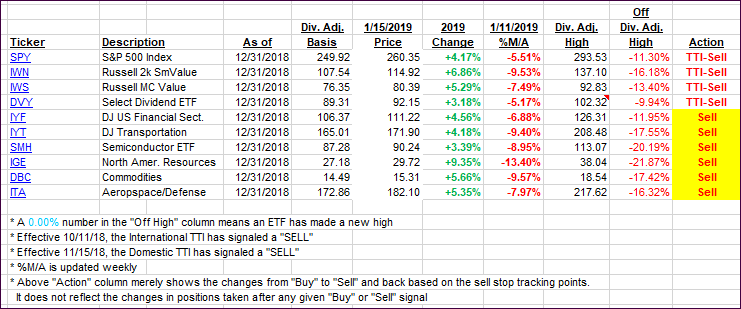
The below table simply demonstrates the magnitude with which some of the ETFs are fluctuating regarding their positions above or below their respective individual trend lines (%M/A). A break below, represented by a negative number, shows weakness, while a break above, represented by a positive percentage, shows strength.
For hundreds of ETF choices, be sure to reference Thursday’s StatSheet.
Year to date, here’s how our original candidates from the last cycle have fared:
Again, the %M/A column above shows the position of the various ETFs in relation to their respective long-term trend lines, while the trailing sell stops are being tracked in the “Off High” column. The “Action” column will signal a “Sell” once the -8% point has been taken out in the “Off High” column. For more volatile sector ETFs, the trigger point is -10%.
- Trend Tracking Indexes (TTIs)
Our Trend Tracking Indexes (TTIs) improved as the pendulum swung the other way.
Here’s how we closed 01/15/2019:
Domestic TTI: -4.56% below its M/A (last close -5.28%)—Sell signal effective 11/15/2018
International TTI: -4.50% below its M/A (last close -5.05%)—Sell signal effective 10/11/2018
Disclosure: I am obliged to inform you that I, as well as my advisory clients, own some of the ETFs listed in the above table. Furthermore, they do not represent a specific investment recommendation for you, they merely show which ETFs from the universe I track are falling.
Contact Ulli

