
- Moving the markets
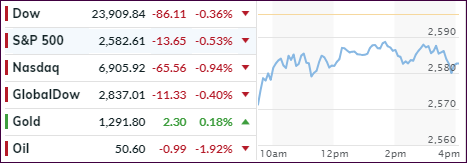
An early sharp drop gave way to a bounce throughout the session, but conviction was lacking in the face of ugly China trade data, and by association, more concerns again over a general global slowdown.
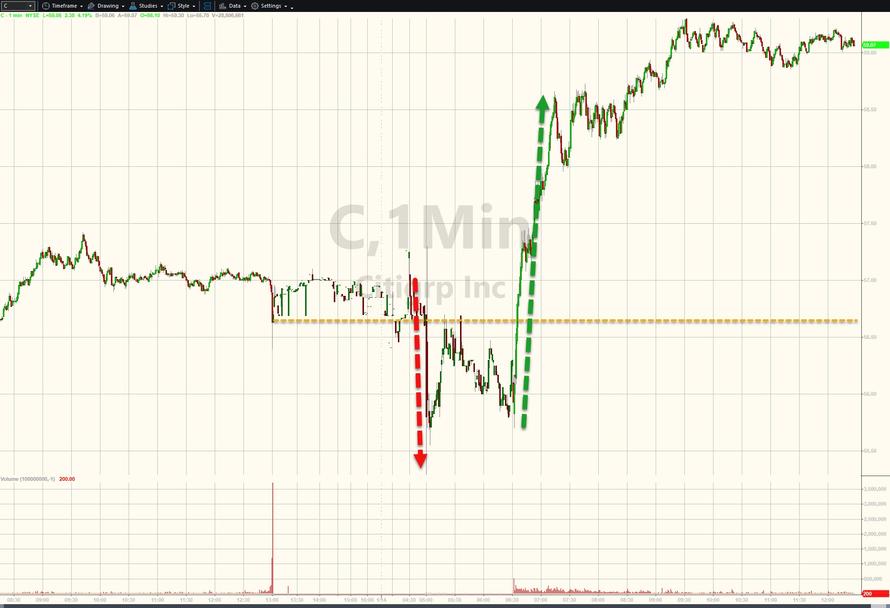
Adding to the uncertainty was the beginning of earnings season, which many analysts view with some skepticism after a mixed Q4 2018, during which the S&P 500 got clobbered at the rate of -14%. Citi Bank started things out, was bashed at first due to disappointing revenues, but recovered and rallied.
Still, much of today’s early damage was wiped out when Trump threw an assist by proclaiming “very good China talks,” which has been a reliable standby for months to prop up the markets. They did rally, but not in convincing fashion as the major indexes still ended up with losses for the day.
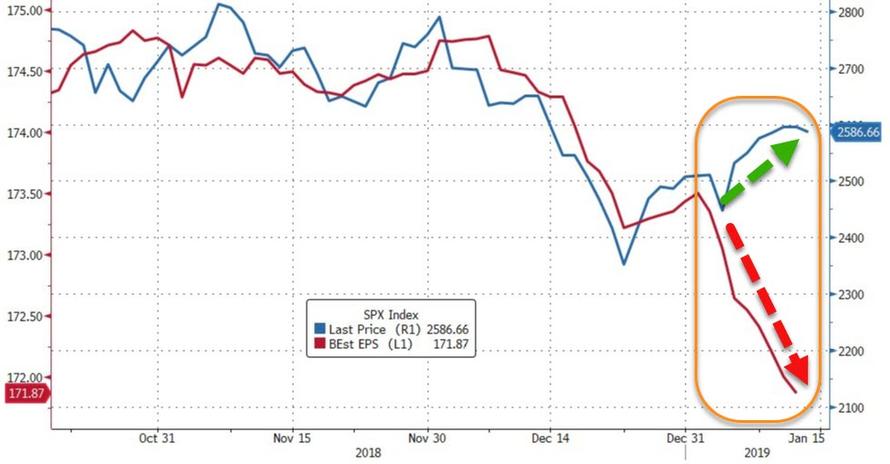
In regard to earnings, forward expectations are disconnected from the S&P 500, as this chart (thanks to ZH) shows. That leaves the question wide open as to which direction the eventual “connect” will occur, which in turn will then give some clue as to who will dominate soon: Will it be the bulls of the bears?
We should find out within the next few weeks.
- ETFs in the Spotlight
In case you missed the announcement and description of this section, you can read it here again.
It features 10 broadly diversified and sector ETFs from my HighVolume list as posted every Saturday. Furthermore, they are screened for the lowest MaxDD% number meaning they have been showing better resistance to temporary sell offs than all others over the past year.
The below table simply demonstrates the magnitude with which some of the ETFs are fluctuating regarding their positions above or below their respective individual trend lines (%M/A). A break below, represented by a negative number, shows weakness, while a break above, represented by a positive percentage, shows strength.
For hundreds of ETF choices, be sure to reference Thursday’s StatSheet.
Year to date, here’s how our original candidates from the last cycle have fared:
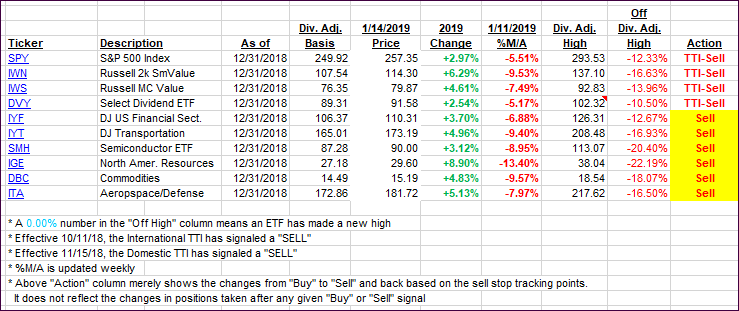
Again, the %M/A column above shows the position of the various ETFs in relation to their respective long-term trend lines, while the trailing sell stops are being tracked in the “Off High” column. The “Action” column will signal a “Sell” once the -8% point has been taken out in the “Off High” column. For more volatile sector ETFs, the trigger point is -10%.
- Trend Tracking Indexes (TTIs)
Our Trend Tracking Indexes (TTIs) worsened as the major indexes headed south.
Here’s how we closed 01/14/2019:
Domestic TTI: -5.28% below its M/A (last close -4.46%)—Sell signal effective 11/15/2018
International TTI: -5.05% below its M/A (last close -4.69%)—Sell signal effective 10/11/2018
Disclosure: I am obliged to inform you that I, as well as my advisory clients, own some of the ETFs listed in the above table. Furthermore, they do not represent a specific investment recommendation for you, they merely show which ETFs from the universe I track are falling.
Contact Ulli