
- Moving the markets
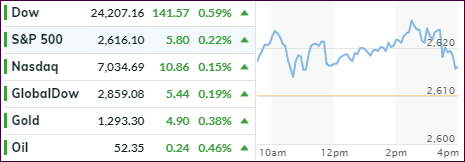
The Dow was leading today’s modest advance after having been the laggard yesterday. Some positive earnings from financial powerhouses Goldman Sachs and BofA gave the assist, while uncertainty over the partial government shut down was on traders’ minds but did not affect market direction.
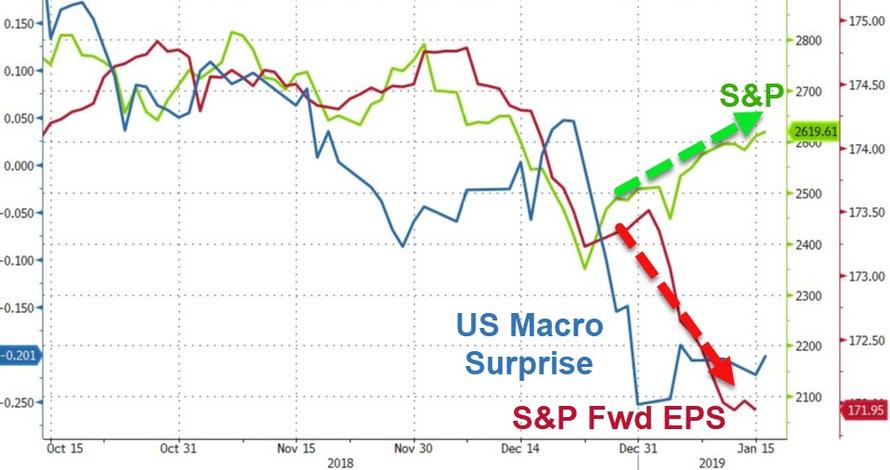
You may be wondering what the real catalyst was that generated and propelled the post-Christmas rally other than President Trump declaring to “buy the dip.” Despite weak economic data points and the Smart Money exiting stocks, we’ve seen sharp swings higher helping the buy-and-hold crowd to reduce the Q4 2018 losses.
ZH shed some light on this phenomenon via their comment “it’s not the economy, it’s the central banks, stupid,” and added this for clarification:
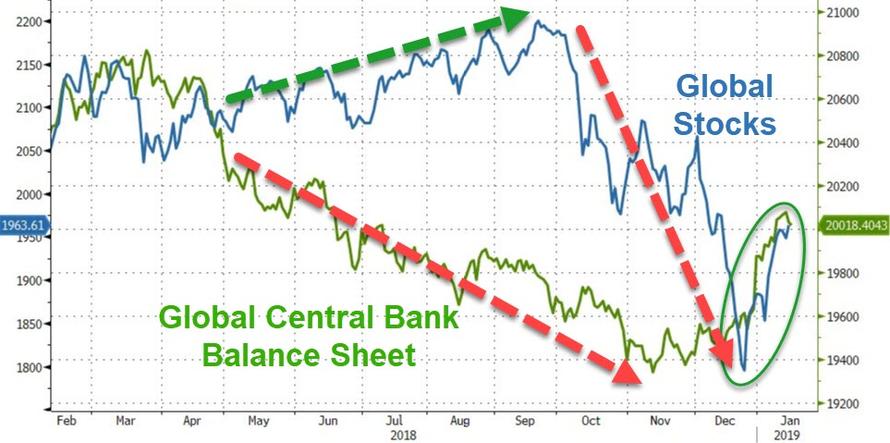
Q4 2018 saw global stock markets finally wake up to the fact that the world’s central banks were withdrawing liquidity and played catch-down to an ugly tightening reality. December’s contagion to American stocks was the final straw for the world’s elites however and after the Mnuchin Massacre, it appears the Plunge Protection was ordered back into battle and as the chart below shows – central bank balance sheets suddenly started to grow – aggressively so… and that is what is dragging stocks higher, squeezing shorts at an unprecedented pace, and economically irrationally levitating P/Es despite a wall of uncertainty ahead.
This chart makes the above abundantly clear. As you can see in the circle on the right, Central Banks’ (CBs) balance sheets suddenly grew sharply (asset purchases) pulling global stocks out of the doldrums. The exact opposite happened when balance sheets were normalized, demonstrated by the drop starting in late September.
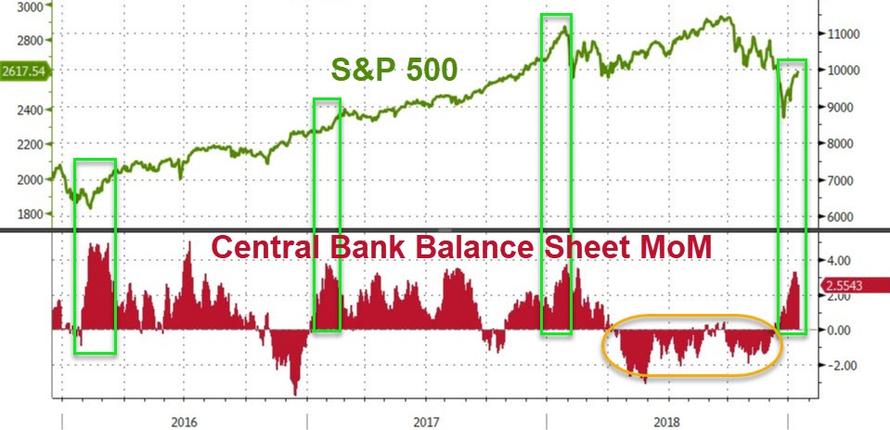
Just like in 2018, 2017, and 2016, the start of the year has prompted a resurgence in the size of global central bank balance sheets… and just like in 2018, 2017, and 2016, global stocks (with US being the most liquid attractor of that flow) are soaring…
And just remember, The ECB is supposed to be tapering, The Fed is still on ‘autopilot’ for now, and The BoJ is being forced to taper its buying size…
And finalizing with:
So, the simple lesson once again is – watch what they do, not what they say!!
While this is only one man’s opinion, it sure explains the irrational exuberance created in the marketplace out of nowhere and with lightening speed.
For us trend trackers the only question is this one: Manipulation or not, will this rebound have enough staying power to push our Trend Tracking Indexes (TTIs) back into “Buy” mode?
As always, no one has the answer, so we’ll to wait for this event to happen. As of today, our Domestic TTI is -4.32% away from a new “Buy” signal.
- ETFs in the Spotlight
In case you missed the announcement and description of this section, you can read it here again.
It features 10 broadly diversified and sector ETFs from my HighVolume list as posted every Saturday. Furthermore, they are screened for the lowest MaxDD% number meaning they have been showing better resistance to temporary sell offs than all others over the past year.
The below table simply demonstrates the magnitude with which some of the ETFs are fluctuating regarding their positions above or below their respective individual trend lines (%M/A). A break below, represented by a negative number, shows weakness, while a break above, represented by a positive percentage, shows strength.
For hundreds of ETF choices, be sure to reference Thursday’s StatSheet.
Year to date, here’s how our original candidates from the last cycle have fared:
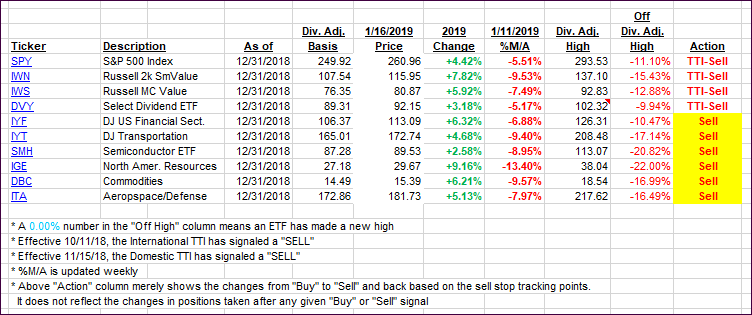
Again, the %M/A column above shows the position of the various ETFs in relation to their respective long-term trend lines, while the trailing sell stops are being tracked in the “Off High” column. The “Action” column will signal a “Sell” once the -8% point has been taken out in the “Off High” column. For more volatile sector ETFs, the trigger point is -10%.
- Trend Tracking Indexes (TTIs)
Our Trend Tracking Indexes (TTIs) gained a tad and moved closer to their respective trend lines.
Here’s how we closed 01/16/2019:
Domestic TTI: -4.32% below its M/A (last close -4.56%)—Sell signal effective 11/15/2018
International TTI: -4.31% below its M/A (last close -4.50%)—Sell signal effective 10/11/2018
Disclosure: I am obliged to inform you that I, as well as my advisory clients, own some of the ETFs listed in the above table. Furthermore, they do not represent a specific investment recommendation for you, they merely show which ETFs from the universe I track are falling.
Contact Ulli