
- Moving the markets
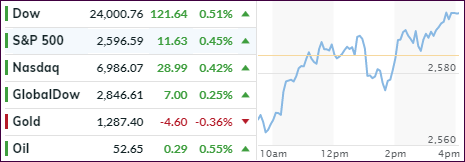
It was another wild ride in the markets when, after an opening dump, dip-buyers (or was it the PPT?) stepped in and pushed the major indexes slowly but surely back above the unchanged line, when another dive pulled them back below it, before a second rebound shoved them into green for a fifth straight day of gains.
Of course, no other event than Fed head Powell speaking can put markets in a tizzy fit like we saw today. He started with “patient,” which worked well for stocks but, then caused a pullback after uttering that the Fed’s balance sheet would be “substantially” lower. Translation: Quantitative Tightening (QT) is still alive. In graphic form, ZH presented it best in this chart.
Nothing else seemed to matter today, as even consumer related headlines were simply ignored. First, there was Macy’s record drop, which had the S&P Department Stores index gasping, as it went into freefall. Not to be outdone, the S&P airline index followed suit, except here the dip-buying crowed stepped in to make this wild ride a non-event, but the move demonstrated that all is not well in consumer land.
And again, ZH took top billing with this chart showing the current divergence between the S&P 500 and its forward EPS (Earning per share). Some analysts have called this rebound a bull trap, meaning this is simply an interruption in an ongoing bear market.
Our Domestic Trend Tracking Index (TTI) confirms that view, at least for the time being, as it is still positioned -4.89% below its long-term trend line.
- ETFs in the Spotlight
In case you missed the announcement and description of this section, you can read it here again.
It features 10 broadly diversified and sector ETFs from my HighVolume list as posted every Saturday. Furthermore, they are screened for the lowest MaxDD% number meaning they have been showing better resistance to temporary sell offs than all others over the past year.
The below table simply demonstrates the magnitude with which some of the ETFs are fluctuating regarding their positions above or below their respective individual trend lines (%M/A). A break below, represented by a negative number, shows weakness, while a break above, represented by a positive percentage, shows strength.
For hundreds of ETF choices, be sure to reference Thursday’s StatSheet.
Year to date, here’s how our original candidates from the last cycle have fared:
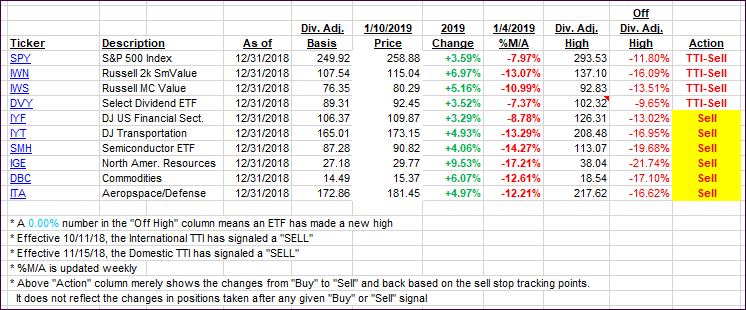
Again, the %M/A column above shows the position of the various ETFs in relation to their respective long-term trend lines, while the trailing sell stops are being tracked in the “Off High” column. The “Action” column will signal a “Sell” once the -8% point has been taken out in the “Off High” column. For more volatile sector ETFs, the trigger point is -10%.
- Trend Tracking Indexes (TTIs)
Our Trend Tracking Indexes (TTIs) moved closer towards a potential upside break of their trend lines.
Here’s how we closed 01/10/2019:
Domestic TTI: -4.89% below its M/A (last close -5.47%)—Sell signal effective 11/15/2018
International TTI: -4.90% below its M/A (last close -5.00%)—Sell signal effective 10/11/2018
Disclosure: I am obliged to inform you that I, as well as my advisory clients, own some of the ETFs listed in the above table. Furthermore, they do not represent a specific investment recommendation for you, they merely show which ETFs from the universe I track are falling.
Contact Ulli