
- Moving the markets
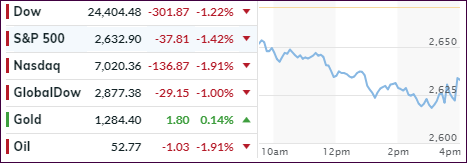
After the relentless buying of the past few weeks, a pause was in order, as I posted last Friday, and that’s what we got today. The markets opened to the downside and never recovered, despite an attempt during the last few trading minutes to minimize the day’s losses.
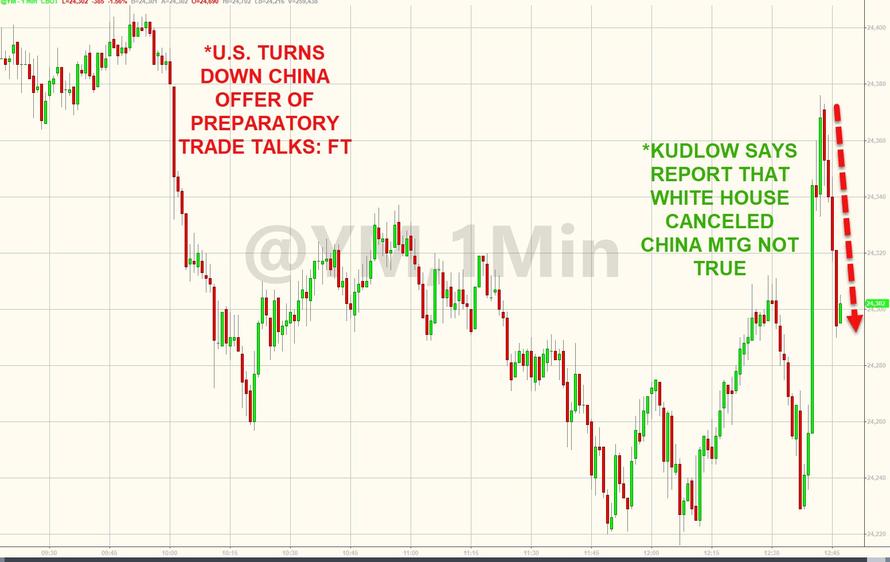
Last week’s hype about a China trade deal evaporated in a hurry, as U.S. officials turned down an offer by China to hold a preparatory meeting on trade negotiations due to lack of progress.
Then, China posted its slowest pace of annual growth (6.6%) since 1990, while some of their communist leaders cautioned to be alert over a “black swan” or “gray rhino” financial event in the face of an economic slowdown…
Additionally, the IMF, International Monetary Fund, added to the gloomy global picture by noting that it had cut global growth from 3.7% to 3.5% but left the U.S. estimate unchanged at 2.5%.
Other economic data points were postponed due to the partial government shutdown, but grim Housing data were released showing that existing sales not only slowed to 3-year lows, but last month’s sales were down 6.4% and 10.3% lower than a year ago.
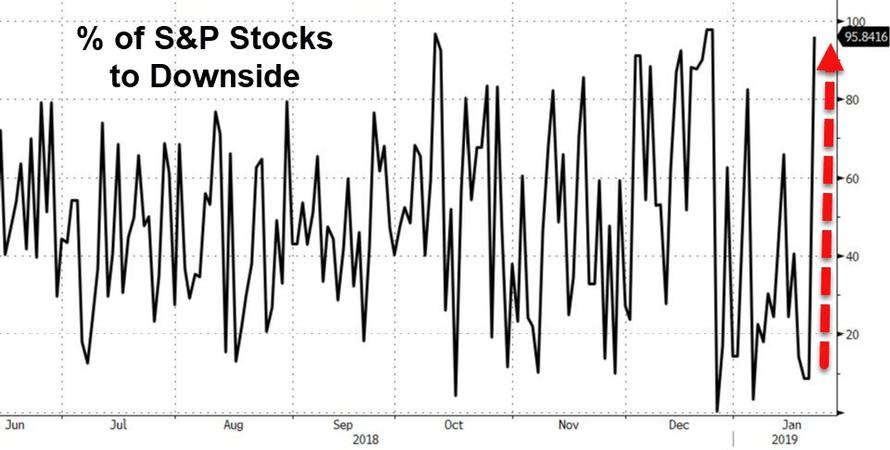
In the end, last Friday’s trade hope gains were wiped out again, while breadth in the markets was bad with 95% of S&P stocks closing to the downside today. This makes me contemplate whether it’s time for stocks to catch down to reality again, as this chart shows.
- ETFs in the Spotlight
In case you missed the announcement and description of this section, you can read it here again.
It features 10 broadly diversified and sector ETFs from my HighVolume list as posted every Saturday. Furthermore, they are screened for the lowest MaxDD% number meaning they have been showing better resistance to temporary sell offs than all others over the past year.
The below table simply demonstrates the magnitude with which some of the ETFs are fluctuating regarding their positions above or below their respective individual trend lines (%M/A). A break below, represented by a negative number, shows weakness, while a break above, represented by a positive percentage, shows strength.
For hundreds of ETF choices, be sure to reference Thursday’s StatSheet.
Year to date, here’s how our original candidates from the last cycle have fared:
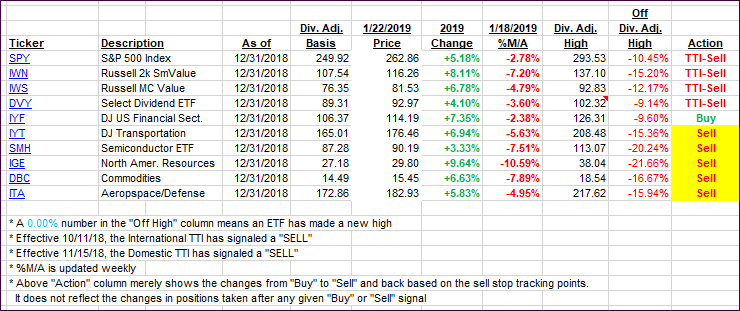
Again, the %M/A column above shows the position of the various ETFs in relation to their respective long-term trend lines, while the trailing sell stops are being tracked in the “Off High” column. The “Action” column will signal a “Sell” once the -8% point has been taken out in the “Off High” column. For more volatile sector ETFs, the trigger point is -10%.
- Trend Tracking Indexes (TTIs)
Our Trend Tracking Indexes (TTIs) headed deeper into bear market territory.
Here’s how we closed 01/22/2019:
Domestic TTI: -3.27% below its M/A (last close -1.96%)—Sell signal effective 11/15/2018
International TTI: -3.55% below its M/A (last close -2.75%)—Sell signal effective 10/11/2018
Disclosure: I am obliged to inform you that I, as well as my advisory clients, own some of the ETFs listed in the above table. Furthermore, they do not represent a specific investment recommendation for you, they merely show which ETFs from the universe I track are falling.
Contact Ulli