
- Moving the markets
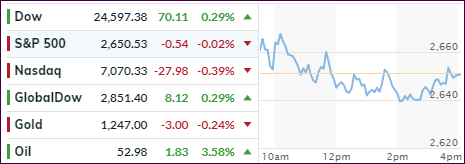
And the same story continues. An early rally ran into overhead resistance with markets fading the remainder of the session with neither bulls nor bears winning the tug-of-war as the “sell the rip” theme lingered on. The major indexes closed mixed with only the Dow squeezing out a fractional gain, while the S&P 500 and Nasdaq slipped into the red.
Looking across all markets, we saw that Transportations (IYT) took a dive, surrendered -1.59% and sank to new lows for 2018 bringing its loss YTD to -7.36%, while airline stocks crashed. Delta’s 2019 profit view was the culprit, as it missed expectations. Banks stock joined the trip to lower prices after a brief bounce of hope yesterday.
Bond yields seem to have found a temporary bottom, at least for the 10-year, which is lending support at the 2.80% level, as this chart shows. However, today’s move was minor and had no effect on equity direction. The markets need to find a new driver to support bullish hope but, until that emerges, we may be riding the bearish range for a while.
- ETFs in the Spotlight
In case you missed the announcement and description of this section, you can read it here again.
It features 10 broadly diversified and sector ETFs from my HighVolume list as posted every Saturday. Furthermore, they are screened for the lowest MaxDD% number meaning they have been showing better resistance to temporary sell offs than all others over the past year.
The below table simply demonstrates the magnitude with which some of the ETFs are fluctuating regarding their positions above or below their respective individual trend lines (%M/A). A break below, represented by a negative number, shows weakness, while a break above, represented by a positive percentage, shows strength.
For hundreds of ETF choices, be sure to reference Thursday’s StatSheet.
Year to date, here’s how our original candidates have fared:
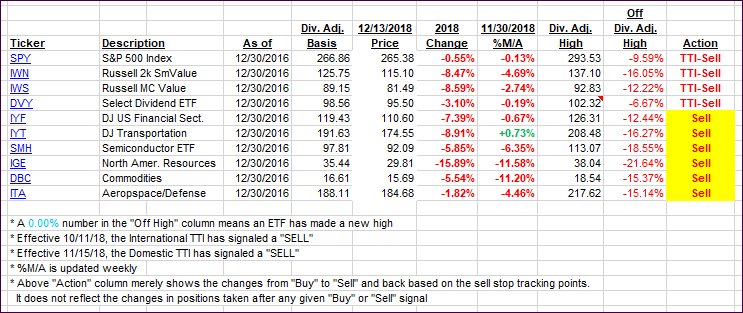
Again, the %M/A column above shows the position of the various ETFs in relation to their respective long-term trend lines, while the trailing sell stops are being tracked in the “Off High” column. The “Action” column will signal a “Sell” once the -8% point has been taken out in the “Off High” column. For more volatile sector ETFs, the trigger point is -10%.
- Trend Tracking Indexes (TTIs)
Our Trend Tracking Indexes (TTIs) were mixed with the Domestic one sinking deeper into bear territory, while the International one showed a slight improvement from yesterday.
Here’s how we closed 12/13/2018:
Domestic TTI: -4.84% below its M/A (last close -4.39%)—Sell signal effective 11/15/2018
International TTI: -5.67% below its M/A (last close -5.99%)—Sell signal effective 10/11/2018
Disclosure: I am obliged to inform you that I, as well as my advisory clients, own some of the ETFs listed in the above table. Furthermore, they do not represent a specific investment recommendation for you, they merely show which ETFs from the universe I track are falling.
Contact Ulli