
- Moving the markets
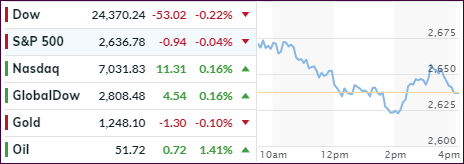
An early follow through to the upside from yesterday’s rebound ran into resistance quickly, as traders were more comfortable adopting the mantra “let’s sell the rip” rather than believing the rally had substance to it.
The Dow and the S&P 500 surrendered all gains and closed in the red with the Nasdaq barely hanging on to the plus side. Opinions vary widely these days about the Santa Claus rally with one analyst referring to it as a “violent and crushing move higher” taking shape this month.
While that is certainly possible, but maybe not probable, the question in my mind remains whether that would be just another bear-market blow-off, or an actual break back into bullish territory. I guess we’ll have to wait for the answer.
The news headlines were the same in today’s choppy session. Optimism around US/China trade talks faded in a hurry with market momentum losing even more steam on Trump’s threat of a government shutdown, as border-wall funding talks with Democratic leaders turned into a nothing burger.
Markets hate uncertainty the most, and that’s why we ended up at the unchanged line. For the time being, our bearish view remains alive and well with our Trend Tracking Indexes (section 3) continue to be positioned below their respective trend lines.
- ETFs in the Spotlight
In case you missed the announcement and description of this section, you can read it here again.
It features 10 broadly diversified and sector ETFs from my HighVolume list as posted every Saturday. Furthermore, they are screened for the lowest MaxDD% number meaning they have been showing better resistance to temporary sell offs than all others over the past year.
The below table simply demonstrates the magnitude with which some of the ETFs are fluctuating regarding their positions above or below their respective individual trend lines (%M/A). A break below, represented by a negative number, shows weakness, while a break above, represented by a positive percentage, shows strength.
For hundreds of ETF choices, be sure to reference Thursday’s StatSheet.
Year to date, here’s how our original candidates have fared:
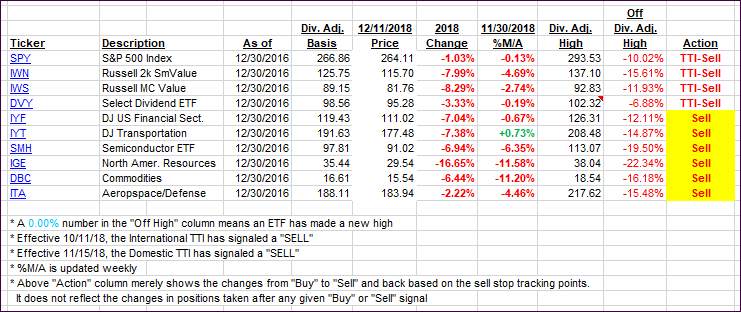
Again, the %M/A column above shows the position of the various ETFs in relation to their respective long-term trend lines, while the trailing sell stops are being tracked in the “Off High” column. The “Action” column will signal a “Sell” once the -8% point has been taken out in the “Off High” column. For more volatile sector ETFs, the trigger point is -10%.
- Trend Tracking Indexes (TTIs)
Our Trend Tracking Indexes (TTIs) showed a mixed picture and changed only immaterially.
Here’s how we closed 12/11/2018:
Domestic TTI: -4.87% below its M/A (last close -4.80%)—Sell signal effective 11/15/2018
International TTI: -7.08% below its M/A (last close -7.29%)—Sell signal effective 10/11/2018
Disclosure: I am obliged to inform you that I, as well as my advisory clients, own some of the ETFs listed in the above table. Furthermore, they do not represent a specific investment recommendation for you, they merely show which ETFs from the universe I track are falling.
Contact Ulli