
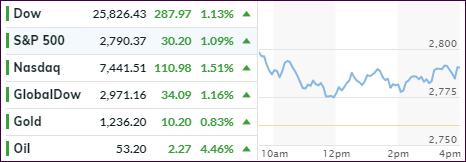
- Moving the markets
Even poor economic data points such as Ford announcing 25k job cuts, or subprime auto loan issuance soaring, could not derail the no-deal Trump and Xi announcement from the G-20 meeting. The agreement to hold off with any major changes resembled a temporary truce and nothing else. The US agreed to keep the current 10% tariffs for another 3 months in return for China’s promise to purchase a greater amount of American goods.
That was enough for the computer algos to shift into overdrive and push the major indexes higher on a nothing-burger deal that could unravel just as quickly. Said more crudely, it could turn out to be a dump-and-pump scheme.
Be that as it may, for right now the bulls are in charge, and our Domestic Trend Tracking Index (TTI) jumped back above its long-term trend line and into bullish territory by +0.68%. I am always very suspicious of these sudden moves up, or down, and will therefore play it cautiously, since sudden up-moves tend to be of an ephemeral nature and often based on exuberance.
That means, I will watch for a few days to see if these current levels can be sustained or improved upon before issuing a new “Buy” signal for “broadly diversified domestic equity ETFs.” This approach will hopefully contribute to avoid another whip-saw signal. I also plan to allocate only a portion of clients’ asset into the low volatility spectrum.
Stay tuned!
- ETFs in the Spotlight
In case you missed the announcement and description of this section, you can read it here again.
It features 10 broadly diversified and sector ETFs from my HighVolume list as posted every Saturday. Furthermore, they are screened for the lowest MaxDD% number meaning they have been showing better resistance to temporary sell offs than all others over the past year.
The below table simply demonstrates the magnitude with which some of the ETFs are fluctuating regarding their positions above or below their respective individual trend lines (%M/A). A break below, represented by a negative number, shows weakness, while a break above, represented by a positive percentage, shows strength.
For hundreds of ETF choices, be sure to reference Thursday’s StatSheet.
Year to date, here’s how our original candidates have fared:
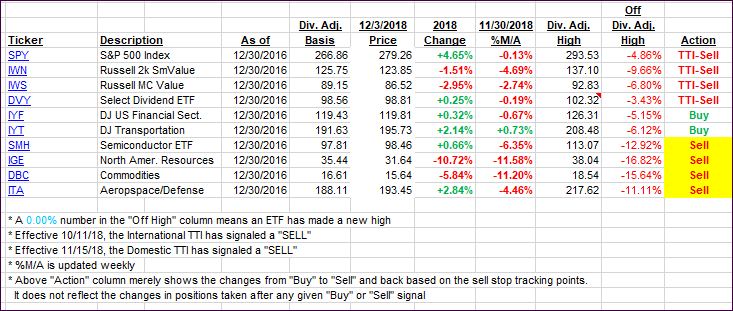
Again, the %M/A column above shows the position of the various ETFs in relation to their respective long-term trend lines, while the trailing sell stops are being tracked in the “Off High” column. The “Action” column will signal a “Sell” once the -8% point has been taken out in the “Off High” column. For more volatile sector ETFs, the trigger point is -10%.
- Trend Tracking Indexes (TTIs)
Our Trend Tracking Indexes (TTIs) improved with the Domestic one crossing back into bullish territory. I’ll wait and watch a few days to see if this level can be maintained before pulling the “Buy” trigger.
Here’s how we closed 12/3/2018:
Domestic TTI: +0.68% above its M/A (last close -0.52%)—Sell signal effective 11/15/2018
International TTI: -1.96% below its M/A (last close -3.09%)—Sell signal effective 10/11/2018
Disclosure: I am obliged to inform you that I, as well as my advisory clients, own some of the ETFs listed in the above table. Furthermore, they do not represent a specific investment recommendation for you, they merely show which ETFs from the universe I track are falling
Contact Ulli