
- Moving the markets
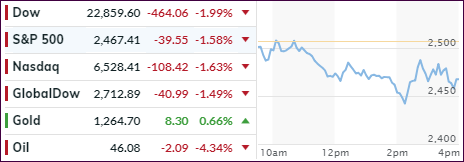
There was simply no hope at all for the bulls today, as we headed south right after the opening bell. Not helping the anxiety among traders were news that Trump was reluctant to sign a bill that would extend funding for the government to avoid a partial shutdown. That remark took the major indexes down another notch.
The edgy market mood continued when the Nasdaq dropped some -2.1% and came within striking distance of touching its bear market level, defined as a drop of -20% from recent highs.
I am sure that critical point will be breached, especially since the Fed announced the shrinkage of its balance sheet to be on “auto pilot.” Translation: Stocks are on their own for the first time in a decade, as the Fed pursues its Quantitative Tightening. Not a good outlook for the bulls…
Then hedge fund guru David Tepper opined that the “Fed’s lifeline is gone,” referring to the assumed Fed “put” that allowed markets to only sink to a certain level, before they would step in and rescue equity investors via their various QE programs. That’s one of the reasons why we have not seen any bear markets since 2009. During that period, I identified several of them, but they all were magically saved by sudden bullish sentiment.
Adding to the miserable mood on Wall Street was the Fed’s Dudley when he chimed in by adding that “The Fed is not there to take away the market’s pain,” and that “The Fed does not care about market prices for themselves.”
Wow, you can’t be any more direct than that…
In the end, it was another ugly day with the major indexes now down -10% for the month, while Transportations and SmallCaps fared even worse.
How low can we go?
This chart of the tightening of financial conditions index suggests another 300 points on the S&P, at least for right now. However, other forecasts I have seen point to much lower levels.
It’s good not to participate in this financial disaster with $16.7 trillion of market cap having been erased from global stock markets this year. Ouch!
- ETFs in the Spotlight
In case you missed the announcement and description of this section, you can read it here again.
It features 10 broadly diversified and sector ETFs from my HighVolume list as posted every Saturday. Furthermore, they are screened for the lowest MaxDD% number meaning they have been showing better resistance to temporary sell offs than all others over the past year.
The below table simply demonstrates the magnitude with which some of the ETFs are fluctuating regarding their positions above or below their respective individual trend lines (%M/A). A break below, represented by a negative number, shows weakness, while a break above, represented by a positive percentage, shows strength.
For hundreds of ETF choices, be sure to reference Thursday’s StatSheet.
Year to date, here’s how our original candidates have fared:
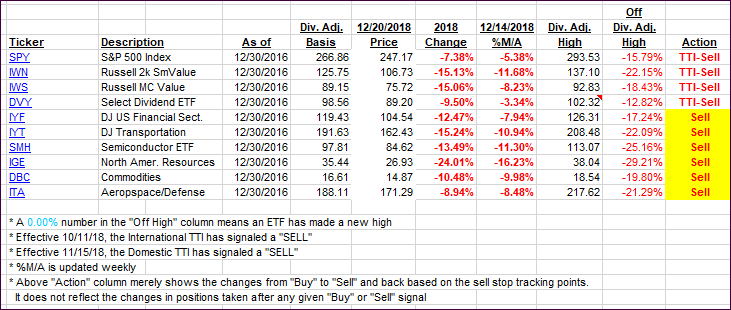
Again, the %M/A column above shows the position of the various ETFs in relation to their respective long-term trend lines, while the trailing sell stops are being tracked in the “Off High” column. The “Action” column will signal a “Sell” once the -8% point has been taken out in the “Off High” column. For more volatile sector ETFs, the trigger point is -10%.
- Trend Tracking Indexes (TTIs)
Our Trend Tracking Indexes (TTIs) dove again as the major indexes got spanked.
Here’s how we closed 12/20/2018:
Domestic TTI: -11.08% below its M/A (last close -9.66%)—Sell signal effective 11/15/2018
International TTI: -10.01% below its M/A (last close -8.83%)—Sell signal effective 10/11/2018
Disclosure: I am obliged to inform you that I, as well as my advisory clients, own some of the ETFs listed in the above table. Furthermore, they do not represent a specific investment recommendation for you, they merely show which ETFs from the universe I track are falling.
Contact Ulli