
ETF Tracker StatSheet
A WEEK OF WILD SWINGS
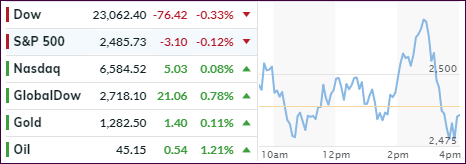
- Moving the markets
I am certain that a lot of Wall Street traders are glad that this week, which gave a new meaning to the word “volatility,” is finally over. Despite only 4 trading sessions, a huge drop was followed by an amazing recovery, however, no clear directional tendencies became apparent as the chart above shows.
As I have repeatedly posted, these types of wild swings in both directions are the hallmark of bear markets, because you won’t find this type of extreme jaw dropping activity when we are in bullish mode. After a disastrous December, the major indexes finally managed a green weekly close with the S&P 500 recovering +2.9% but still being down -10% for the month. Ouch!
ZeroHege observed that today was a big fake out based on hope that more pension bids were coming but didn’t. Here are some highlights:
And once traders realized that this was just one giant fake out meant to force stops and squeeze shorts, they started buying… bonds, with the 10Y yield sliding as low as 2.7146%, the lowest since February 2018. And as the bond were bid, stocks tumbled losing all intraday gains, and turning negative.
Meanwhile, as it became clear that no real pension bid was coming, the selling returned, and stocks closed near session lows, with the Dow losing almost 400 points of gains and briefly dropping below 23,000 although the selloff was far more controlled than the liquidation puke observed on Monday.
At the end of the day, the Dow was the biggest loser, the S&P was modestly lower, while the Nasdaq closed just green thanks to a strong bid for the FANGs.
Meanwhile, on the economic front home sales crashed -7.7%, which was the biggest drop in four years. They slid -0.7% in November vs. a 1% expected increase confirming that the real estate downturn is alive and well.
Looking at the big picture, we can see that even the know-it-all usually calm Wall Street analysts are simply bewildered about these frantic price movements in the markets, which makes forecasting anything but a wild guess. Currently, there is no rhyme or reason to be part of this absolute uncertainty and insanity.
In my advisor practice, we will remain on the sidelines until this bear market has run its course rather than trying to be a hero and catch the proverbial falling knife. Our Domestic Trend Tacking Index (TTI) remains firmly entrenched on the bearish side of its trend line by a substantial -10.17%. Bearish tendencies may have a way to go, and we don’t want any part of it.
- ETFs in the Spotlight
In case you missed the announcement and description of this section, you can read it here again.
It features 10 broadly diversified and sector ETFs from my HighVolume list as posted every Saturday. Furthermore, they are screened for the lowest MaxDD% number meaning they have been showing better resistance to temporary sell offs than all others over the past year.
The below table simply demonstrates the magnitude with which some of the ETFs are fluctuating regarding their positions above or below their respective individual trend lines (%M/A). A break below, represented by a negative number, shows weakness, while a break above, represented by a positive percentage, shows strength.
For hundreds of ETF choices, be sure to reference Thursday’s StatSheet.
Year to date, here’s how our original candidates have fared:
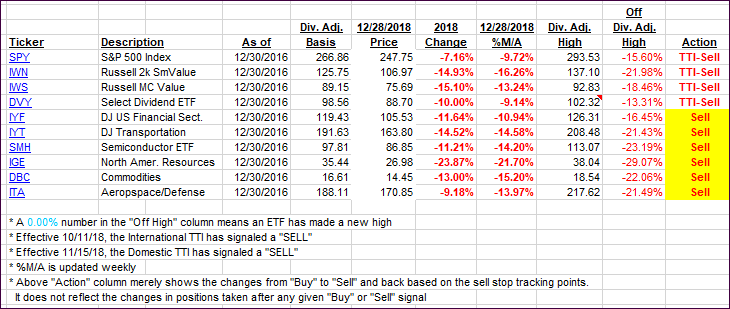
Again, the %M/A column above shows the position of the various ETFs in relation to their respective long-term trend lines, while the trailing sell stops are being tracked in the “Off High” column. The “Action” column will signal a “Sell” once the -8% point has been taken out in the “Off High” column. For more volatile sector ETFs, the trigger point is -10%.
- Trend Tracking Indexes (TTIs)
Our Trend Tracking Indexes (TTIs) changed only slightly as market direction was predominantly sideways.
Here’s how we closed 12/28/2018:
Domestic TTI: -10.17% below its M/A (last close -10.64%)—Sell signal effective 11/15/2018
International TTI: -9.37% below its M/A (last close -10.25%)—Sell signal effective 10/11/2018
Disclosure: I am obliged to inform you that I, as well as my advisory clients, own some of the ETFs listed in the above table. Furthermore, they do not represent a specific investment recommendation for you, they merely show which ETFs from the universe I track are falling.
————————————————————-
READER Q & As
All Reader Q & A’s are listed at our web site!
Check it out at:
https://theetfbully.com/questions-answers/
———————————————————-
WOULD YOU LIKE TO HAVE YOUR INVESTMENTS PROFESSIONALLY MANAGED?
Do you have the time to follow our investment plans yourself? If you are a busy professional who would like to have his portfolio managed using our methodology, please contact me directly or get more details at:
https://theetfbully.com/personal-investment-management/
———————————————————
Back issues of the ETF/No Load Fund Tracker are available on the web at:
https://theetfbully.com/newsletter-archives/
Contact Ulli