
- Moving the markets
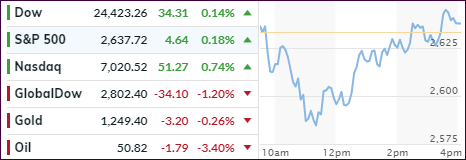
Stocks took an early dump to start the week, with the Dow being down at one point by 500 points, but a mid-day slow and steady rebound assisted the major indexes to slip back above the unchanged line by a moderate margin.
I can’t tell if the Plunge Protection Team (PPT) was at it again or if the recent adage “Sell the rally” was suddenly reversed with a “buy the dip” mentality but, after the sell-off we’ve seen, some hopeful bottom-fishers were simply bound to show up.
Intra-day, things did not look so good, as the S&P 500 took out its October low of 2,604 by touching the 2,583 level, which is in striking distance of the 2018 lows made back in February during the first crash of the year. Some projections are calling for new lows, should a close below the critical 2,616 number materialize.
The S&P’s death-cross was also confirmed. It simply means that the widely followed 50-day M/A crossed the below the 200-day M/A, which validates that we are locked in bear market territory, a position which our Domestic TTI has been signaling since 11/15/18.
European and Asian markets were not so lucky, as dip buyers were conspicuously absent punishing their major equity indexes. After Europe closed, US stocks started their levitation followed by a short squeeze helping the US markets being the only one with a green close.
Looking at the big picture, not all sectors fared well. SmallCaps tumbled again to their worst level since September 2017, while the Financials were suffering, as bank stocks collapsed for the 4th day in a row.
It goes to show you that a few green numbers are meaningless when most markets are trending lower confirming the current bearish bias. SMART money has recognized that by getting out of equities, as this chart clearly shows. The Globally Systemically Important Banks Stock (GSIB) Index is saying the same thing.
Until a new bullish theme is clearly confirmed, being on the sidelines makes the most sense, since a new “market puke” can occur suddenly and without warning.
- ETFs in the Spotlight
In case you missed the announcement and description of this section, you can read it here again.
It features 10 broadly diversified and sector ETFs from my HighVolume list as posted every Saturday. Furthermore, they are screened for the lowest MaxDD% number meaning they have been showing better resistance to temporary sell offs than all others over the past year.
The below table simply demonstrates the magnitude with which some of the ETFs are fluctuating regarding their positions above or below their respective individual trend lines (%M/A). A break below, represented by a negative number, shows weakness, while a break above, represented by a positive percentage, shows strength.
For hundreds of ETF choices, be sure to reference Thursday’s StatSheet.
Year to date, here’s how our original candidates have fared:
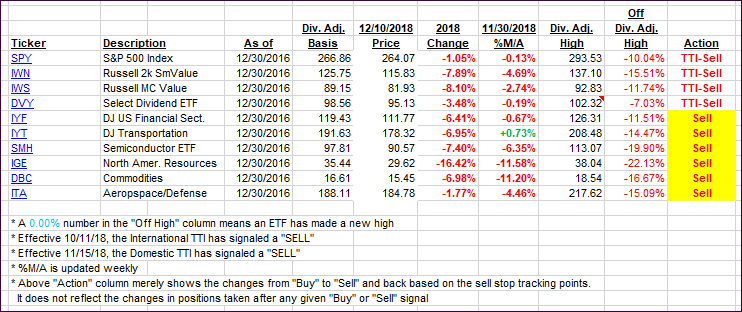
Again, the %M/A column above shows the position of the various ETFs in relation to their respective long-term trend lines, while the trailing sell stops are being tracked in the “Off High” column. The “Action” column will signal a “Sell” once the -8% point has been taken out in the “Off High” column. For more volatile sector ETFs, the trigger point is -10%.
- Trend Tracking Indexes (TTIs)
Our Trend Tracking Indexes (TTIs) headed deeper into bear market terrain with especially the International one demonstrating a swan dive.
Here’s how we closed 12/10/2018:
Domestic TTI: -4.80% below its M/A (last close -4.62%)—Sell signal effective 11/15/2018
International TTI: -7.29% below its M/A (last close -6.18%)—Sell signal effective 10/11/2018
Disclosure: I am obliged to inform you that I, as well as my advisory clients, own some of the ETFs listed in the above table. Furthermore, they do not represent a specific investment recommendation for you, they merely show which ETFs from the universe I track are falling.
Contact Ulli