
- Moving the markets
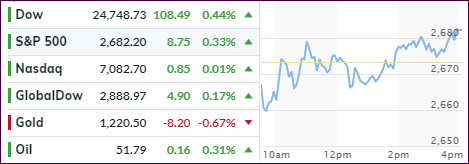
For most of the session, the major indexes see-sawed in and out of the red before, late in the day, cautious optimism prevailed insuring a green close. The gains were small, especially for the Nasdaq which barely crawled above the unchanged line. Despite the positive tone, SmallCaps (IWN) were not so lucky and got spanked at the tune of -0.60%.
Keeping market direction in check were remarks from President Trump regarding Chinese tariffs, when he refused to rule any increases in the future. Trump and Xi will meet this weekend in Buenos Aires at the G-20 summit. If there are any positive news coming out of this meeting, I believe the markets will take off and likely start the much-anticipated year-end rally. If no agreement is reached, we may see the aimless meandering continue.
After yesterday’s pop, GM’s stock price slid almost 3%, when Trump announced that he is looking at withdrawing subsidies as a result of the car maker’s decision to close plants and layoff almost 15k employees in the US and Canada.
EU and Italy tensions were back on, as Italy reneged on yesterday’s softening tone regarding their budget deficit pulling the European markets down into the red after an opening pop.
The US dollar rallied again and is now within striking distance of its 2018 highs, while gold retreated and oil is desperately hanging on to the $50 handle. Despite Trump’s economic advisor Kudlow spouting off that “our economy is in good shape, China’s is not,” global markets don’t see it that way, as the direction across the board remains “down” and not “up.”
- ETFs in the Spotlight
In case you missed the announcement and description of this section, you can read it here again.
It features 10 broadly diversified and sector ETFs from my HighVolume list as posted every Saturday. Furthermore, they are screened for the lowest MaxDD% number meaning they have been showing better resistance to temporary sell offs than all others over the past year.
The below table simply demonstrates the magnitude with which some of the ETFs are fluctuating regarding their positions above or below their respective individual trend lines (%M/A). A break below, represented by a negative number, shows weakness, while a break above, represented by a positive percentage, shows strength.
For hundreds of ETF choices, be sure to reference Thursday’s StatSheet.
Year to date, here’s how our original candidates have fared:
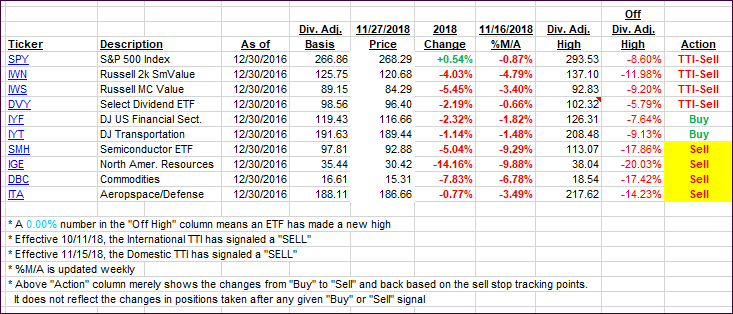
Again, the %M/A column above shows the position of the various ETFs in relation to their respective long-term trend lines, while the trailing sell stops are being tracked in the “Off High” column. The “Action” column will signal a “Sell” once the -8% point has been taken out in the “Off High” column. For more volatile sector ETFs, the trigger point is -10%.
- Trend Tracking Indexes (TTIs)
Our Trend Tracking Indexes (TTIs) barely changed as the markets traded predominantly sideways.
Here’s how we closed 11/27/2018:
Domestic TTI: -2.33% below its M/A (last close -2.38%)—Sell signal effective 11/15/2018
International TTI: -4.79% below its M/A (last close -4.99%)—Sell signal effective 10/11/2018
Disclosure: I am obliged to inform you that I, as well as my advisory clients, own some of the ETFs listed in the above table. Furthermore, they do not represent a specific investment recommendation for you, they merely show which ETFs from the universe I track are falling within the guidelines specified.
Contact Ulli