
ETF Tracker StatSheet
A Good Week Ends On A Sour Note
- Moving the markets
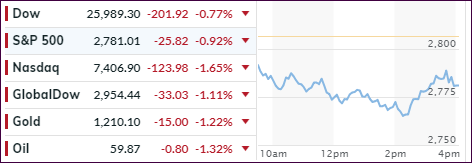
It was another roller-coaster week, with the major indexes gaining, thanks to Wednesday’s super ramp, but some reality sat in the last couple of days and pulled the major indexes off their lofty levels.
Today’s drop started when Trump’s main China advisor spooked the markets in a speech by not only lashing out at China but also accusing Wall Street of “shuttle diplomacy” and finally dismissing any prospect of a deal. That took the starch out of bullish momentum and south we went.
Not helping matters were reports that US Producer Prices surged the most in 6 years, which was the biggest spike since late 2012. Bond yields should have jumped, but didn’t, since investors leaving stocks and piled into bonds, thereby driving prices higher with the 10-year giving back 5 basis points to end at 3.19%.
Still, the sour ending of this week left Wall Street pondering whether Wednesday’s post-election rally was simply an outlier or the resumption of the long-term bullish trend. No one knows for sure, but the old standby fears like trade wars, interest rates, China, financial conditions, peak earnings and a slowing global economy are still alive and well.
While the major indexes gained for the week, the FANG stocks were not so lucky and ended in the red after surrendering all previous gains.
During these times of uncertainty, it pays to use low volatility ETFs, which I have done in my advisor practice during this recent domestic “Buy” cycle. For example, SPY lost -0.98% today, while my favorite low volatility ETF only gave back -0.05%, yet YTD it has outperformed the S&P 500 by over 2%.
For more details about the position of our Trend Tracking Indexes (TTIs), please see section 3 below.
- ETFs in the Spotlight
In case you missed the announcement and description of this section, you can read it here again.
It features 10 broadly diversified and sector ETFs from my HighVolume list as posted every Saturday. Furthermore, they are screened for the lowest MaxDD% number meaning they have been showing better resistance to temporary sell offs than all others over the past year.
The below table simply demonstrates the magnitude with which some of the ETFs are fluctuating regarding their positions above or below their respective individual trend lines (%M/A). A break below, represented by a negative number, shows weakness, while a break above, represented by a positive percentage, shows strength.
For hundreds of ETF choices, be sure to reference Thursday’s StatSheet.
Year to date, here’s how our candidates have fared so far:
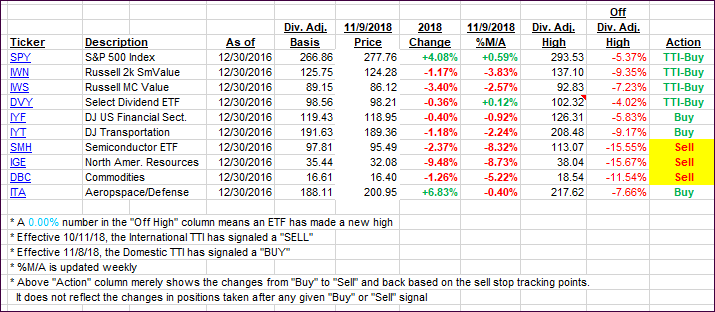
Again, the %M/A column above shows the position of the various ETFs in relation to their respective long-term trend lines, while the trailing sell stops are being tracked in the “Off High” column. The “Action” column will signal a “Sell” once the -8% point has been taken out in the “Off High” column. For more volatile sector ETFs, the trigger point is -10%.
- Trend Tracking Indexes (TTIs)
Our Trend Tracking Indexes (TTIs) were mixed again. While the International one is stuck in bear market territory, the Domestic one sits right on its trend line and could move either way.
I will have to see a clear break to the downside, along with staying power, before declaring this “Buy” signal to be a whipsaw. Fortunately, our current market exposure is based on low volatility meaning that a pullback, such as we saw today, moved our position only by meager -0.05%.
Here’s how we closed 11/09/2018:
Domestic TTI: +0.01% above its M/A (last close +1.04%)—Buy signal effective 11/08/2018
International TTI: -3.04% below its M/A (last close -2.20%)—Sell signal effective 10/11/2018
Disclosure: I am obliged to inform you that I, as well as my advisory clients, own some of the ETFs listed in the above table. Furthermore, they do not represent a specific investment recommendation for you, they merely show which ETFs from the universe I track are falling within the guidelines specified.
————————————————————-
READER Q & As
All Reader Q & A’s are listed at our web site!
Check it out at:
https://theetfbully.com/questions-answers/
———————————————————-
WOULD YOU LIKE TO HAVE YOUR INVESTMENTS PROFESSIONALLY MANAGED?
Do you have the time to follow our investment plans yourself? If you are a busy professional who would like to have his portfolio managed using our methodology, please contact me directly or get more details at:
https://theetfbully.com/personal-investment-management/
———————————————————
Back issues of the ETF/No Load Fund Tracker are available on the web at:
https://theetfbully.com/newsletter-archives/
Contact Ulli