
ETF Tracker StatSheet
Trump Saves The Day For The Bulls
- Moving the markets
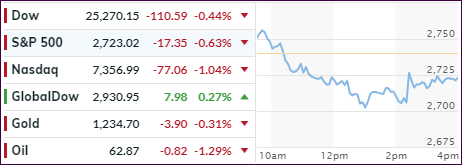
Sometimes you just have to laugh. The markets were in a downswing for most of the day mainly as a result of two events.
First, Apple’s earnings report card, while not bad, disappointed with especially their forward guidance not being very encouraging despite the upcoming Christmas season. The immediate punishment was a drop in the stock price of some 7%, which pulled the entire tech sector down over 1%.
Second, October payrolls surged by 250k and exceeded expectations. While that should have been good news, it wasn’t. On the contrary. This appears to be the nail in the interest rate coffin with a December hike now being virtually assured, as the report showed that wages rose at the fastest pace in nine years, which indicates that inflationary pressures are in our future. The unemployment rate remained at 3.7%, its lowest since 1969.
This caused the markets to pick up downward momentum with the Dow being down 250 points at one time. Then, Trump started to talk China trade. First, there were denials from three While House officials off the record and Larry Kudlow on the record that trade talks were progressing. Suddenly, during the last hour, Trump stepped up and told reporters that “China talks are going well,” “the US will reach a trade deal with China,” and “getting closer to doing something with China.”
That was enough to shift the computer algos not only into reverse but also into overdrive and mysterious buying pressure appeared out of nowhere, stocks recovered, and cut the mid-day losses in half. Looking at the entire week, it has become clear, that a giant short squeeze helped the bulls to climb out of a deep hole, but falling short of reversing the technical damage done in red October.
Bond yields surged by 8 basis points today with the 10-year closing at 3.22%. That clobbered the widely held 20-year bond ETF (TLT) by -1.24% to a level last seen in March of 2017.
We remain on the sidelines until our Domestic Trend Tracking Indexes (section 3) move back into bullish territory.
- ETFs in the Spotlight
In case you missed the announcement and description of this section, you can read it here again.
It features 10 broadly diversified and sector ETFs from my HighVolume list as posted every Saturday. Furthermore, they are screened for the lowest MaxDD% number meaning they have been showing better resistance to temporary sell offs than all others over the past year.
The below table simply demonstrates the magnitude with which some of the ETFs are fluctuating regarding their positions above or below their respective individual trend lines (%M/A). A break below, represented by a negative number, shows weakness, while a break above, represented by a positive percentage, shows strength.
For hundreds of ETF choices, be sure to reference Thursday’s StatSheet.
Year to date, here’s how our candidates have fared so far:
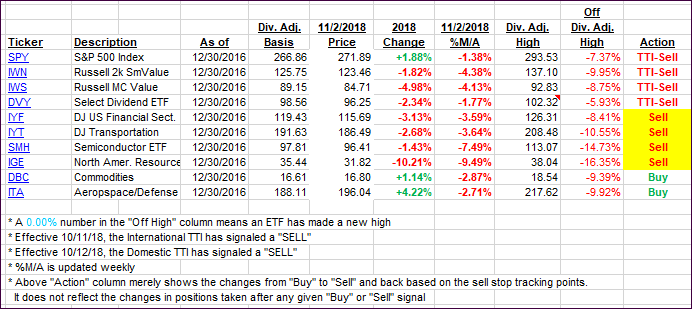
Again, the %M/A column above shows the position of the various ETFs in relation to their respective long-term trend lines, while the trailing sell stops are being tracked in the “Off High” column. The “Action” column will signal a “Sell” once the -8% point has been taken out in the “Off High” column. For more volatile sector ETFs, the trigger point is -10%.
- Trend Tracking Indexes (TTIs)
Our Trend Tracking Indexes (TTIs) were mixed with the Domestic one slipping and the International one gaining a tad. Both, however, remain on the bearish side of the trend line.
Here’s how we closed 11/02/2018:
Domestic TTI: -1.83% below its M/A (last close -1.51%)—Sell signal effective 10/12/2018
International TTI: -3.88% below its M/A (last close -4.28%)—Sell signal effective 10/11/2018
Disclosure: I am obliged to inform you that I, as well as my advisory clients, own some of the ETFs listed in the above table. Furthermore, they do not represent a specific investment recommendation for you, they merely show which ETFs from the universe I track are falling within the guidelines specified.
————————————————————-
READER Q & As
All Reader Q & A’s are listed at our web site!
Check it out at:
https://theetfbully.com/questions-answers/
———————————————————-
WOULD YOU LIKE TO HAVE YOUR INVESTMENTS PROFESSIONALLY MANAGED?
Do you have the time to follow our investment plans yourself? If you are a busy professional who would like to have his portfolio managed using our methodology, please contact me directly or get more details at:
https://theetfbully.com/personal-investment-management/
———————————————————
Back issues of the ETF/No Load Fund Tracker are available on the web at:
https://theetfbully.com/newsletter-archives/
Contact Ulli