
- Moving the markets
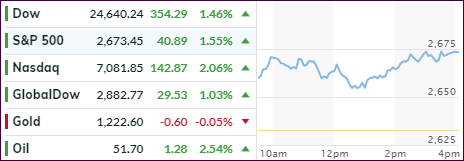
After last week’s drubbing, it came as no surprise that a rebound was in order. Closely watched was the retail sector with analysts trying to gain some perspective as to the shopping traffic leading into the Holiday season. The picture was mixed, and not conclusive, as in-story traffic fell as much as 9% compared to last year’s Black Friday. However, internet sales made up for it by rising 26.4% year over year.
That was good enough to get a rally going, which was further supported by an easing of the stand-off between Italy and the EU regarding the budget deficit. That helped European markets to surge with the effects spilling over into the US.
Today looked like an oversold bounce, along with the biggest short-squeeze in some 4 weeks, giving the bulls finally as say in the outcome of this session. On the other hand, GM’s news of closing several plants and laying off over 14,000 people should have dampened the animal spirits but did not as GM’s stock was halted but soared 7%. Go figure… At the same time, the other American icon, GE, tumbled to cycle lows, but managed to cut intra-day losses.
On deck is the G-20 summit meeting this coming weekend where for sure Trump and his Chinese counterpart Xi will meet and create a flurry of headline news about the hottest topic, namely trade tensions. Any outcome, that can be confirmed as positive is sure to ignite the markets and may create the much talked about year-end rally.
Our Trend Tracking Indexes (TTIs) improved but remain on the bearish side of their respective trend lines for the time being. I am sure, the roller coaster ride is bound to continue, but should the path shift in favor of the bulls, we will jump back in at that time.
- ETFs in the Spotlight
In case you missed the announcement and description of this section, you can read it here again.
It features 10 broadly diversified and sector ETFs from my HighVolume list as posted every Saturday. Furthermore, they are screened for the lowest MaxDD% number meaning they have been showing better resistance to temporary sell offs than all others over the past year.
The below table simply demonstrates the magnitude with which some of the ETFs are fluctuating regarding their positions above or below their respective individual trend lines (%M/A). A break below, represented by a negative number, shows weakness, while a break above, represented by a positive percentage, shows strength.
For hundreds of ETF choices, be sure to reference Thursday’s StatSheet.
Year to date, here’s how our original candidates have fared:
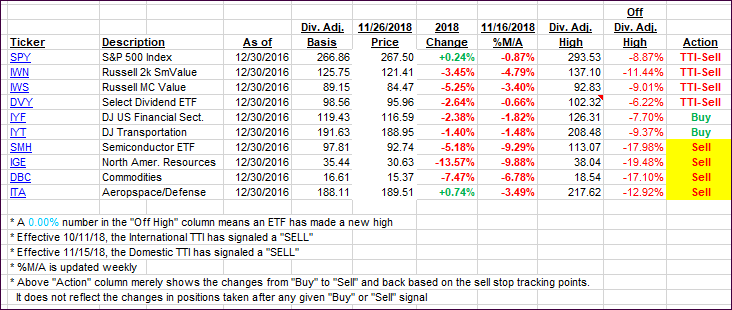
Again, the %M/A column above shows the position of the various ETFs in relation to their respective long-term trend lines, while the trailing sell stops are being tracked in the “Off High” column. The “Action” column will signal a “Sell” once the -8% point has been taken out in the “Off High” column. For more volatile sector ETFs, the trigger point is -10%.
- Trend Tracking Indexes (TTIs)
Our Trend Tracking Indexes (TTIs) improved but remain stuck below their respective trend lines.
Here’s how we closed 11/26/2018:
Domestic TTI: -2.38% below its M/A (last close -3.68%)—Sell signal effective 11/15/2018
International TTI: -4.99% below its M/A (last close -5.54%)—Sell signal effective 10/11/2018
Disclosure: I am obliged to inform you that I, as well as my advisory clients, own some of the ETFs listed in the above table. Furthermore, they do not represent a specific investment recommendation for you, they merely show which ETFs from the universe I track are falling within the guidelines specified.
Contact Ulli