
- Moving the markets
Over the weekend, I read a couple of articles outlining the ongoing progress, or rather lack thereof, with the China trade talks, which took on a new dimension during the Asia-Pacific Economic Cooperation (APEC) summit.
We’ve witnessed Trump and Xi go at it for several months now, but VP Pence decided more was needed and jumped in the fray by trading sharply worded barbs with Xi, which crushed any hope of trade war de-escalation. Not only did relationships worsen but the APEC summit ended without an agreement for the first time in its history.
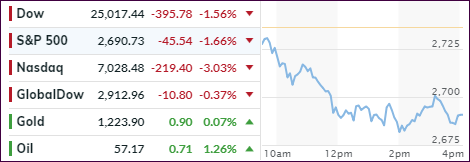
With trade headlines being able to move markets up or down, it came as no surprise to me that the major indexes opened sharply to the downside and stayed there throughout the session. An afternoon bounce was quickly wiped out and we ended deeply in the red, with especially the Nasdaq getting hit the hardest, which was its worst daily loss since “red” October.
Apple did its contribution to overall weakness, as the tech darling surrendered almost 4% and also slipped into bear market territory (-20.2%) to join other fallen heavyweights (FANG stocks) that had contributed to drive the markets to previous records. The FANGs are now down -26.5% from their highs and hovering deeply in bear market terrain.
Home builder confidence tumbled the most since 2014, as housing appears to have caught a cold. Being one of the economically most sensitive sectors, home builders (XHB) can often be the canary in the coal mine as far as future equity direction is concerned. This chart makes it clear that this arena is not showing any strength, especially due the fact that XHB is down -22.71% YTD.
One of the directional leaders are High Yield Bonds, which can signal a shift in sentiment. If history repeats itself, this chart would indicate that there is a lot more pain to come for equities, which would not surprise me, since our Trend Tracking Indexes (TTIs in section 3) have already shown that, for the time being, the bears haven taken charge.
- ETFs in the Spotlight
In case you missed the announcement and description of this section, you can read it here again.
It features 10 broadly diversified and sector ETFs from my HighVolume list as posted every Saturday. Furthermore, they are screened for the lowest MaxDD% number meaning they have been showing better resistance to temporary sell offs than all others over the past year.
The below table simply demonstrates the magnitude with which some of the ETFs are fluctuating regarding their positions above or below their respective individual trend lines (%M/A). A break below, represented by a negative number, shows weakness, while a break above, represented by a positive percentage, shows strength.
For hundreds of ETF choices, be sure to reference Thursday’s StatSheet.
Year to date, here’s how our candidates have fared so far:
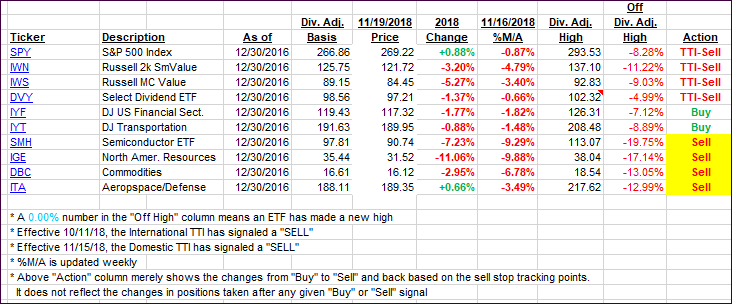
Again, the %M/A column above shows the position of the various ETFs in relation to their respective long-term trend lines, while the trailing sell stops are being tracked in the “Off High” column. The “Action” column will signal a “Sell” once the -8% point has been taken out in the “Off High” column. For more volatile sector ETFs, the trigger point is -10%.
- Trend Tracking Indexes (TTIs)
Our Trend Tracking Indexes (TTIs) took a dive and confirmed the bearish sentiment for the time being.
Here’s how we closed 11/19/2018:
Domestic TTI: -2.35% below its M/A (last close -1.06%)—Sell signal effective 11/15/2018
International TTI: -4.23% below its M/A (last close -3.82%)—Sell signal effective 10/11/2018
Disclosure: I am obliged to inform you that I, as well as my advisory clients, own some of the ETFs listed in the above table. Furthermore, they do not represent a specific investment recommendation for you, they merely show which ETFs from the universe I track are falling within the guidelines specified.
Contact Ulli